


Market Outlook for Metals, Stocks and U.S. Dollar
Stock-Markets / Financial Markets 2012 Aug 05, 2012 - 04:42 AM GMTBy: Chad_Bennis

 This past week saw a number of headline driven news as central banks attempt to intervene in the global economic fiasco. They have pledged to goose the monetary supply by instituting bond purchasing programs in their respective nations, but all we have is talk and the action is yet to come. So, let’s take a step back and examine the technical picture outside of any promises to act.
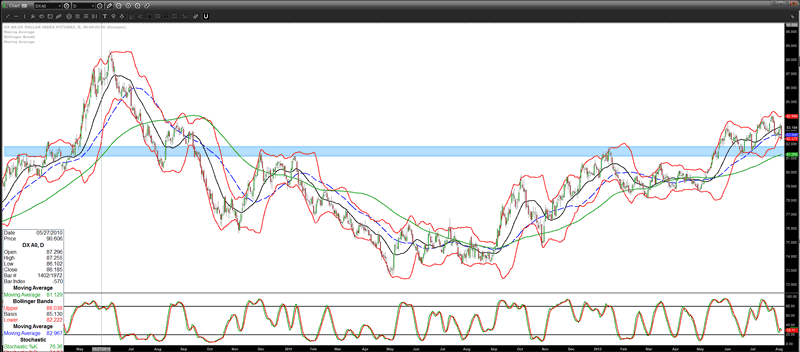
The US dollar index just took out a swing low on an intermediate uptrend that began back in May. It appears to be heading back to the 81.50 area to find support. The 81.50 area has been been acting as a resistance and support level since 2010. If the 81.50 area does not hold the action then the beginning of a bigger downtrend could be in place. If the 81.50 area provides support on this pull back the dollar may be in a longer term uptrend that has been working higher since the bottom last September.
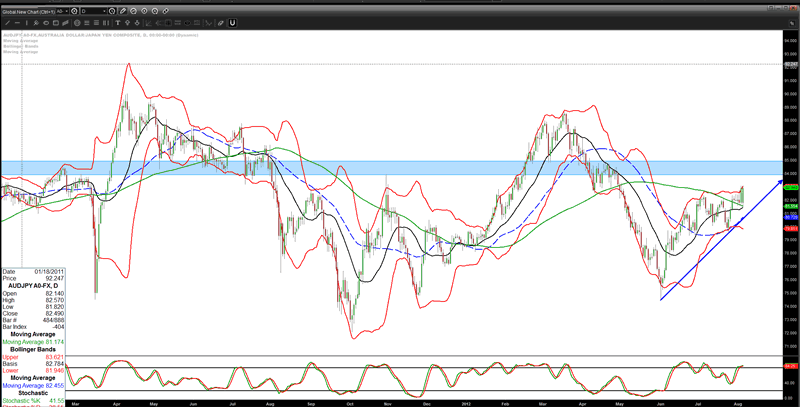
The aussie/yen has been trending higher since the bottom in June. This pair is indicative of what the hedge fund money is doing in the market. As the price action moves higher the risk on trade will remain in effect. Once the price action moves lower the risk off trade is in control. The chart show successive highs in price action which is reflected in the US markets as the equities have been pushing higher along with some commodities beginning to show signs of life after the last year of deflationary pressures in that sector. If this chart can push through the resistance at the 84.50 level and trend higher then the markets should remain bullish in their price action. This chart is nearing its resistance zone as the US dollar index is nearing support. This very well may be a decisive moment in this years risk on vs. risk off environment. Attention needs to be acute as we enter these areas as a reversal in the risk sector may be swift.
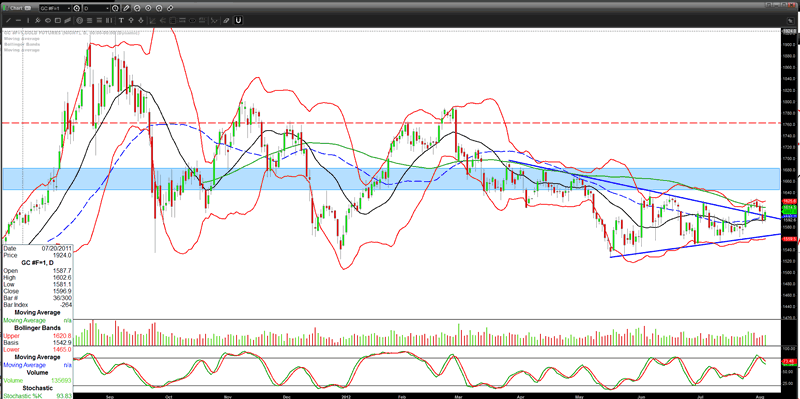
Gold has recently began trending higher off the base it has been building in the 1550 area over the summer. The moving averages are starting to point upwards as a bullish crossover is in process of being confirmed. The chart shows overhead resistance in the 1650-1680 area. The 1680 area needs to be cleared to the upside for a trending move to really kick in for a good rally into the end of the year. If the central banks follow through on their promise to print money over the next couple of months then this chart should really move with new highs on the horizon.
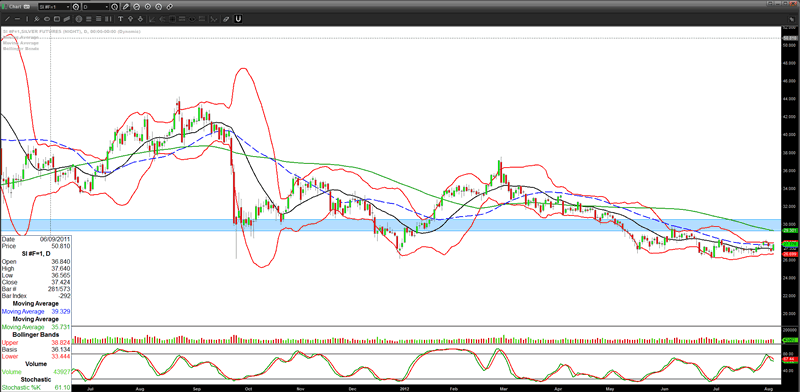
Silver has started to move higher after basing the last year in the 26.50 area. But, like gold, silver has some major overhead resistance between 29 and 30 dollars. If silver can clear 30 and begin moving higher then it may be safe to assume that its correction from last May is coming to an end.
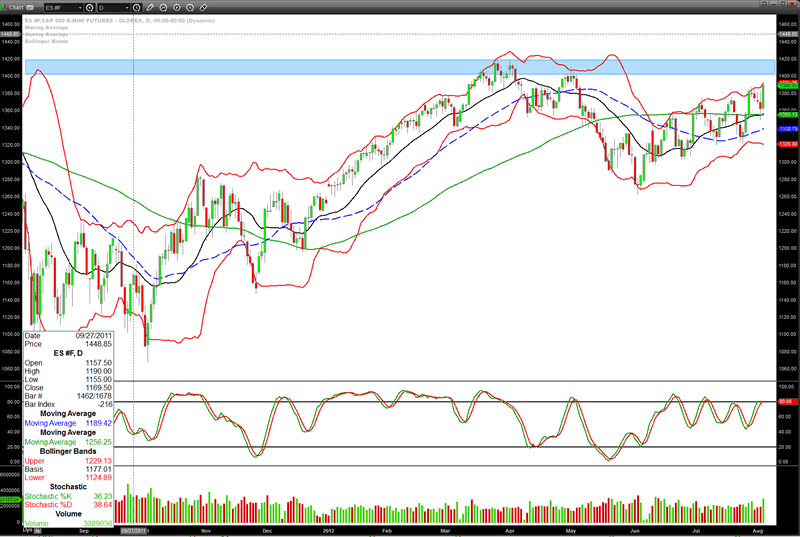
The S&P 500 is approaching the highs it achieved in May of this year. The 1400-1420 level may provide resistance along with an obvious place for some to take some profits off the table if they missed the opportunity in May. The 1430 level also provided stiff resistance in May of 2008 before the market rolled over into the crash. Caution is warranted before buying into this current uptrend.
As the technical picture above is laid out it should be obvious that price action is heading to a crucial point in which the bulls and the bears will be battling it out to see which has control of this market going into the end of the year. It may very well depend on central bank policy as this year seems to have been driven by the words of each central bank chairman. Caution is recommended as we enter support or resistance in each of these charts. No matter which way the market chooses to move there appears to be some action setting up which will be exciting.
CA Bennis
www.wheatcorncattlepigs.com
© 2012 Copyright CA Bennis - All Rights Reserved
Disclaimer: The above is a matter of opinion provided for general information purposes only and is not intended as investment advice. Information and analysis above are derived from sources and utilising methods believed to be reliable, but we cannot accept responsibility for any losses you may incur as a result of this analysis. Individuals should consult with their personal financial advisors.
© 2005-2022 http://www.MarketOracle.co.uk - The Market Oracle is a FREE Daily Financial Markets Analysis & Forecasting online publication.