


Gold and Silver Bullish Omens
Commodities / Gold and Silver 2012 Jul 31, 2012 - 08:48 AM GMTBy: Peter_Degraaf

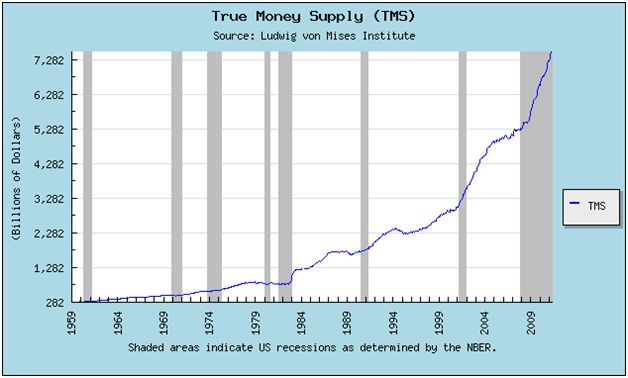
 This chart courtesy Mises.org shows the true U.S. money supply. The trend is exponential and this trend may well put pressure on gold and silver to rise in response. According to Erste Group Research the combined Base Money Supply of the four most important Central Banks has been growing at 15.2% per year since 2000!
“This Currency, as we manage it, is a wonderful machine. It performs its Office when we issue it; it pays and clothes Troops, and provides Victuals and Ammunition; and when we are obliged to issue a quantity excessive, it pays itself off by Depreciation.” .....Benjamin FRANKLIN
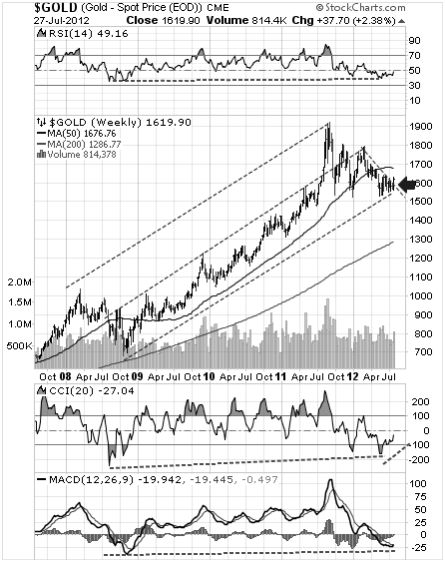
Featured is the weekly gold chart with a five year perspective. Price is breaking out in similar fashion to the breakout in 2009 - after the 2008 pullback. The supporting indicators are bouncing up from support levels (green lines).
.....On Friday the bullion dealer Standard Bank noted: “There currently is a large short position in Comex gold. Since 2004 (when physically backed gold ETFs were introduced to the market), there have been just five times that the size of the Comex gold non-commercial short positions stood out.”
Three of these short spikes were followed by subsequent gains of 25%, 23% and 36%. The exception was the crash year of 2008. In that case gold did nothing for three months — and then rose 19%.
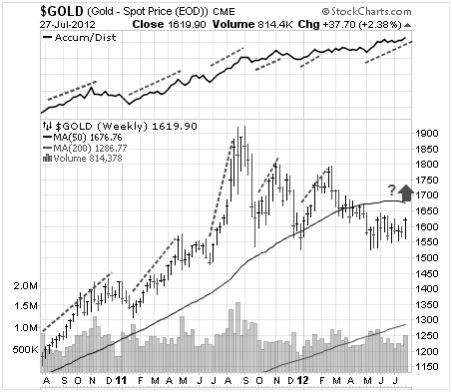
Featured is the weekly gold chart with the Accumulation/Distribution line at the top. Notice how a rise in the A/D line is almost always matched by a rise in the gold price. The latest jump in the A/D line is not (yet) matched by gold. The expectation is that unless the A/D line should suddenly decline, gold is likely to advance. According to the Financial Times of July 19th, the Shanghai Gold Exchange on August 31st will open to investors from many parts of the world. At the present time this exchange is open only to a few selected parties. By opening up the exchange, the gold exchanges of London and New York will face some serious competition.
“The greatest shock of this decade is that more people are about to lose more money than at any time before in our history. And the second biggest shock will be the incredible amount of money just a relatively small group of people will make at exactly the same time.” …Larry BATES (Author of ‘The New Economic Disorder’)
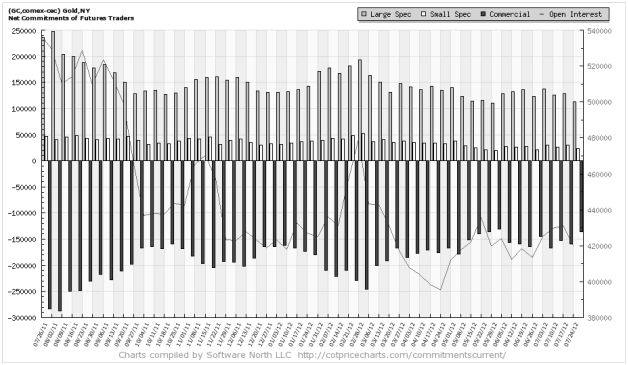
This chart courtesy Cotpricecharts.com shows the number of ‘net short positions’ among commercial gold traders declined from 159,000 to 136,000 this past week. It also shows the hedge funds and large speculators (grey bars) are not yet heavily loaded up with gold contracts. This chart is ‘gold-bullish’.
“Money is too important to be left to central bankers. You essentially have a group of unelected people who have enormous power to affect the economy. I propose replacing the Fed with a laptop computer to calculate the monetary base, and set it to expand it by a predictable 2% per year through war, peace, feast or famine.” .....Milton FRIEDMAN.
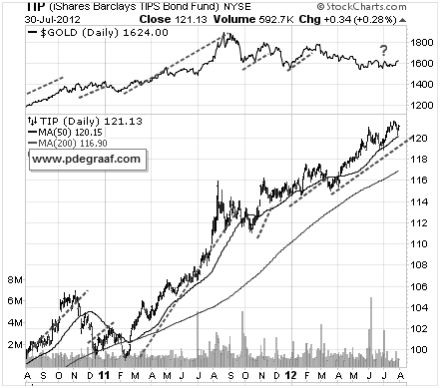
Featured is the daily bar chart for TIP, the bond fund that is indexed for inflation. The price of gold is at the top. Usually, whenever TIP produces a rally it coincides with a rising gold price (five out of five during the past two years). Tip has been rising since April and gold has not (yet) followed. That may change, especially if TIP should continue to bounce off the rising 50DMA.
“Gold is an expression of the world's justifiable distrust of the way our central bankers conduct their affairs.” …..Jim GRANT.
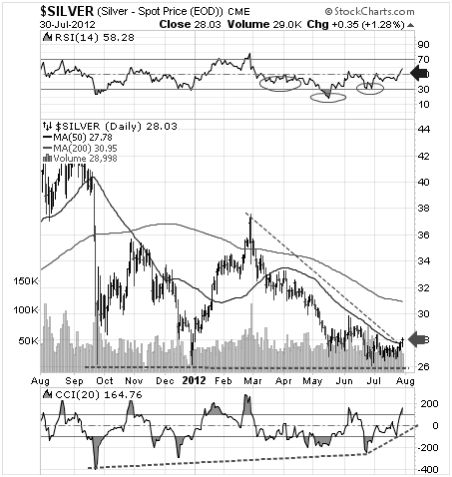
Featured is the daily silver chart. Buying interest in physical silver at 26.00 is providing a floor that has held since October. The CCI at bottom of chart has turned positive (green uptrend line). The silver price is breaking out at the green arrow. The RSI at top of chart displays a bullish inverted ‘head and shoulders’ pattern with the neckline at the blue arrow. This neckline appears ready to give way to the upside. The fact that silver was able to outperform gold on Monday July 30th is a bullish omen.
According to the USGS the total amount of silver mined in history is about 46 billion ounces. This compares to about 5 billion ounces of gold. This ‘mining ratio’ is 9 to 1. The current ‘trading ratio’ is 57 to 1. The ratio is clearly out of whack. In view of the fact that most of the silver consumed by industry is ‘used up’, the expectation is that the ratio could narrow dramatically in the years ahead. Silver usage in the solar industry is expected to rise to 100 million ounces by 2015, compared to 50 million ounces in 2010 (source: Silver Institute).
“In a bull market, every time price comes near or below the 200 day moving average, it represents a buying opportunity.” ….Joseph GRANVILLE.
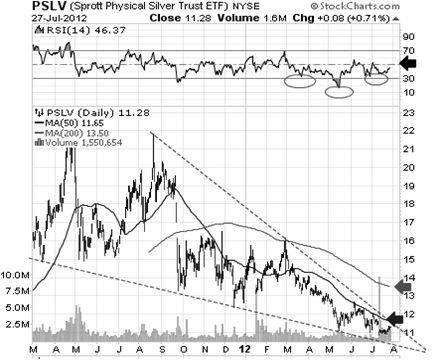
Featured is PSLV the Sprott silver trust. The pattern is a bullish falling wedge. A breakout at the blue arrow sets up a target at the green arrow. A breakout there turns the trend bullish. At the top of the chart is the RSI. Just as in the silver chart above, an inverted ‘head and shoulders’ pattern is visible. This is a bullish pattern and a rise above the black arrow could turn into a strong move for PSLV. ‘Up volume’ is building. The premium over bullion is still low at just 3.03%.
“Money is the most important subject intellectual people can investigate and reflect upon. It is so important that our present civilization may collapse, unless it is widely understood, and its defects remedied very soon. ….. Robert H. HEMPHILL, (Former credit manager, Federal Reserve Bank of Atlanta, GA).
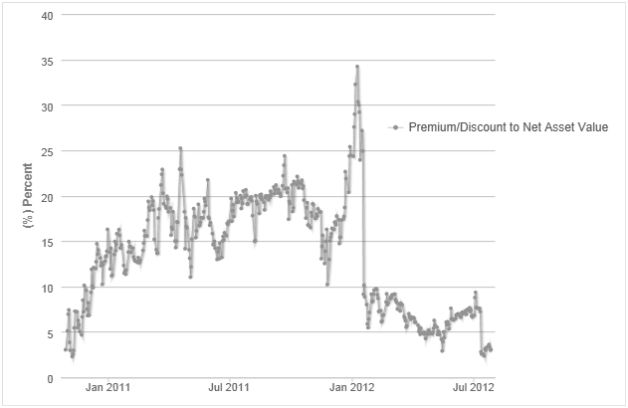
This chart courtesy Sprottphysicalbullion.com shows the premium of PSLV over bullion. By comparing this chart to the PSLV chart above, we find that when the premium rises to 25% or higher, it is time to take profits. When the premium drops below 5% (as now), it is usually a good time to buy silver. According to the U.S. Geological Society: “Silver will be the first element in the periodic table that will become extinct”.
Gabirol, Ibn: “There are four kinds of men in this world:
1. The man who knows, and knows that he knows; he is wise, so consult him.
2. The man who knows, but does not know that he knows; help him to not forget what he knows.
3. The man who knows not, and knows that he knows not; teach him.
4. Finally there is the man who knows not, but pretends that he knows; he is a fool, therefore avoid him.”
Happy trading!
By Peter Degraaf
Peter Degraaf is an on-line stock trader with over 50 years of investing experience. He issues a weekend report on the markets for his many subscribers. For a sample issue send him an E-mail at itiswell@cogeco.net , or visit his website at www.pdegraaf.com where you will find many long-term charts, as well as an interesting collection of Worthwhile Quotes that make for fascinating reading.
© 2012 Copyright Peter Degraaf - All Rights Reserved
DISCLAIMER: Please do your own due diligence. I am NOT responsible for your trading decisions.
Peter Degraaf Archive |
© 2005-2022 http://www.MarketOracle.co.uk - The Market Oracle is a FREE Daily Financial Markets Analysis & Forecasting online publication.