


Next Stocks Bear Market Leg Beginning
Stock-Markets / Stock Markets 2012 Jul 26, 2012 - 07:06 AM GMTBy: Steven_Vincent

 Since the July 9th BullBear Market Report, the US stock market has apparently completed an ABCDE ascending triangle pattern to complete the rally off the June low. This is being confirmed by a mounting body of technical evidence which strongly suggests we have either seen the top to the rally or that it is nearby. The Introduction to the last report still stands as a solid, sound interpretation of the current state of the markets:
In the June 17 issue of the BullBear Market Report, I presented detailed analysis showing that global risk asset markets are already 16 months into a bear market that started in the February-May 2011 time frame. I turned long term bearish on stocks and commodities On June 1, 2011 and turned intermediate term bullish on stocks at the October 2011 bottom. At that time I presented analysis supporting the thesis that US markets could very well make new highs, but that it would be an Elliott Wave "B Wave" high setting up a Major C Wave decline. In April 2012 I turned bearish again and called for the beginning of the main body of the bear market. We did get a decline through May and then a rally in June. A review of the technical market picture at this juncture still supports the conclusion that we are somewhere in a C wave decline and that the recent rally was a corrective move within that context.
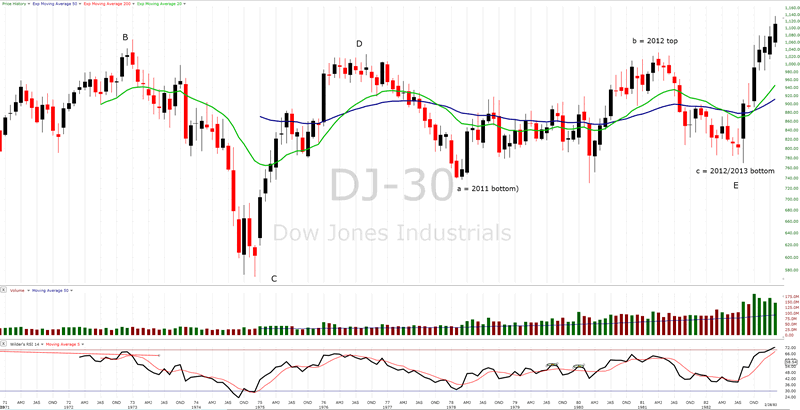
New readers should note that my larger scale analysis is that US equities (and possibly global stocks as well) are in the midst of the final stage of a long term bear market that began in 2000. That bear market has taken the shape of a five wave ABCDE triangle formation and in my view the final leg of the E wave is in progress now. Further scrutiny of the overall conditions of this market reveals the possibility that the anticipated final low will come at a level substantially higher than the 2009 low and perhaps even higher than the 2011 bottom. We may see an end to this bear market that bears significant resemblance to the 1982 low that put an end to the 1966-1982 bear market. There also remains an outlier possibility for a 2008-like panic to lows beyond the March 2009 bottom. In either case, the right side of the market remains the bear side and it's not critical at this time that we know with certainty which outcome will prevail. As the current move unfolds, we will be able to evaluate the technicals to determine the appropriate time to cover shorts and turn around for the ensuing bull market.
While there does seem to be some chance that US markets could rally back to the April high for yet another B wave top, this possibility appears diminished at this time. The panic short covering rally related to the European Summit news appears to have exhausted buying power and reset many indicators from bearish overextended conditions. Shorts entered at these levels stand a fairly good chance of playing out well and there are rather clear, nearby price and technical conditions which will alert the trader that a run back at the highs is in progress. There does seem to be nearly total complacency on the part of the vast majority of market participants with a strong tendency towards an expectation that somehow, someway US equities will continue to levitate. The underlying technicals, as I have been detailing since February, say otherwise. The current technical setup bears striking, alarming resemblance to that which prevailed at the July 2011 highs and there are also some comparisons to the early stages of the 2007-2009 bear market. Having said that, there is some possibility that bears will be rather disappointed with the downside results on this leg, particularly if they are shorting US markets. While continuing to analyze SPX as a key guide to global market movements, it might be best to seek short side exposure in non-US equity markets in order to make the greatest gains during this next (and potentially final) bear wave.
I would slightly modify this outlook to include the possibility that the current bear phase that began in early 2011 is itself a five wave ABCDE triangle and that we are presently in the C leg down of that formation. This would allow for a panic bottom similar to the 2010 and 2011 episodes, followed by a D wave rally spurred by monetary action into a technically oversold market and then followed by a final E of E decline, thus ending the Bear market. This would certainly be the resolution that would serve to frustrate and whipsaw the maximum number of traders and investors, bullish and bearish alike, for the longest period of time (which as experienced traders know is the ultimate function of the market).
At this time there is far too great a bullish consensus on the part of active market participants to mark an end to the long term bear market. There is nothing even remotely approximating the psychology of fear and loathing found at the 1982 bottom at this time, but there certainly could be with one more good washout decline. Premature bulls would then exit the market in disgust, vowing never to return.
There's no doubt that in 1981 many bullish analysts were confronted with a similar set of circumstances and presented similar arguments such as we find today. They knew that stocks were hated, that the public was out, that the economy would eventually turn, that gloom and doom prevailed. They saw that P/E ratios had come down well off their highs and had even arguably fallen into territory that normally marked a buy point. Ultimately, they were proven right, but not before being wrong for over a year and 25%.
Then, just as now, there were bulls who were just as certain that a 25% decline could not happen and bears who were certain that a collapse similar to the period of the Great Depression was inevitable and unavoidable. The market found a way to prove both outlooks wrong. Based on my current analysis, I think we will see a similar resolution this time around as well.
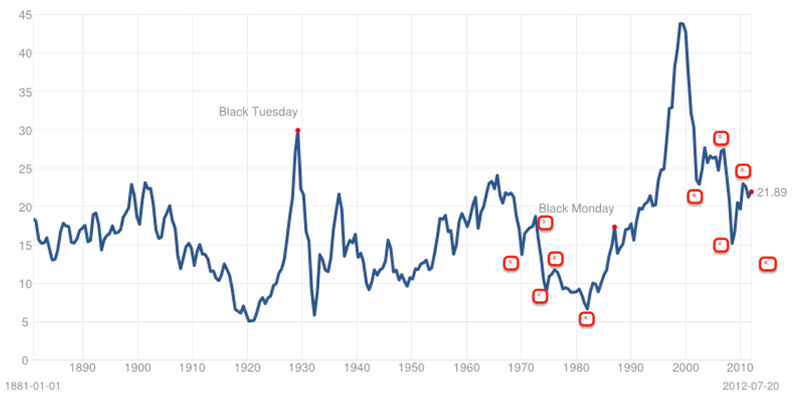
This piece by Doug Short explains the trouble that many analysts are having when trying to factor P/E ratio and earnings into their market view. His chart of Cyclically Adjusted Price Earnings Ratio (CAPE) shows that while the ratio may be substantially lower at this time, it is not at lows which correlate with long term bear market buy points:
Using Robert Schiller's source chart, we can see that, as at the 1976 and 1981 highs, there is certainly room for a final E wave decline in the ratio:
I might also add that bulls are fond of citing "record earnings" as a justification for buying into the current market. That seems to buck common market wisdom. I would be leery of a strategy that calls for buying at a performance peak, particularly when that peak has come about primarily as a result of cost cutting rather than growth.
"Disasterist" ultra bears should be cautioned as well. While I think that the evidence for a significant drop from here far overwhelms any evidence for a significant rally, Uber Bears are also likely to be disappointed with the depth and severity of the decline. Worse, an inability to see the other side of the market will blind them to the ultimate bottom when and if it should arrive.
This interview with former Reagan Administration budget director is a compelling presentation of the Super Bear case:

http://www.marketoracle.co.uk/Article35689.html
Personally I favor his philosophical outlook and I would prefer to see his worldview proven correct and see the Keynsian Monetarist view proven wrong. But wasn't this argument made throughout the 1970's and early 80's? Haven't we been told that the fiat monetary system is "unsustainable" for over 40 years? Yet somehow, some way, the monetary magicians have been able to pull the proverbial rabbit out of the hat time and time again. My current sense is that once again, at the end of this cycle, the funny munny gang will have found some way of extending and pretending the scheme for another 4-5 years, much to the chagrin of the sound minded David Stockman's of the world. While it's certainly far too soon to make any firm projections in this direction, I see the potential for Dow 18,800 by 2017 which would then, finally, mark the top of the grand bull cycle that began in 1932. The piper will be paid, but the bill may not come due for another 5 years or so.
Need some help staying on the right side of the markets? Join the BullBear Traders room at TheBullBear.com. You'll get this kind of timely, incisive, unbiased stock and financial market trading, timing, forecasting and investment technical analysis and commentary daily. It's free to join, no credit card is required and if you like my work you just make a donation at the end of each month.

By Steve Vincent
Steven Vincent has been studying and trading the markets since 1998 and is a member of the Market Technicians Association. He is proprietor of BullBear Trading which provides market analysis, timing and guidance to subscribers. He focuses intermediate to long term swing trading. When he is not charting and analyzing the markets he teaches yoga and meditation in Los Angeles.
© 2011 Copyright Steven Vincent - All Rights Reserved Disclaimer: The above is a matter of opinion provided for general information purposes only and is not intended as investment advice. Information and analysis above are derived from sources and utilising methods believed to be reliable, but we cannot accept responsibility for any losses you may incur as a result of this analysis. Individuals should consult with their personal financial advisors.
© 2005-2022 http://www.MarketOracle.co.uk - The Market Oracle is a FREE Daily Financial Markets Analysis & Forecasting online publication.