


Stock Market Trend Forecast, Put Your Seatbelts On, It’s About To Get Bumpy!
Stock-Markets / Stock Markets 2012 Jul 21, 2012 - 01:29 PM GMTBy: Chris_Vermeulen

 It was just about a year ago today when the S&P was sitting at fresh highs and everyone was enjoying a rather upbeat summer. It was a nice summer, the markets were calm, and there was a surreal sense of optimism. Then, in the matter of a few days, things got real ugly, real quickly.
Well, it doesn’t seem like too much has changed since then. We’ve had mixed earnings reports, ever-evolving worries in Europe, and the always looming fiscal mess in the U.S. Once again, are we in the calm before the storm?
It looks like things in Europe may start to heat up again. Riots turned violent again in Spain as protestors took to the street over austerity measures. With seemingly no resolution, a sinking tourism industry in the PIGS, and a typically hot summer August on its way, all signs point to further turmoil.
Technically, we’re currently seeing a number of bearish indicators setting up in the S&P and other markets. First, on the weekly chart of the SP500 Futures we can see what appears to be a bear flag formation developing. Note the recent rise in price since the beginning of June on decreasing volume.
Weekly SP500 Futures Chart Patterns
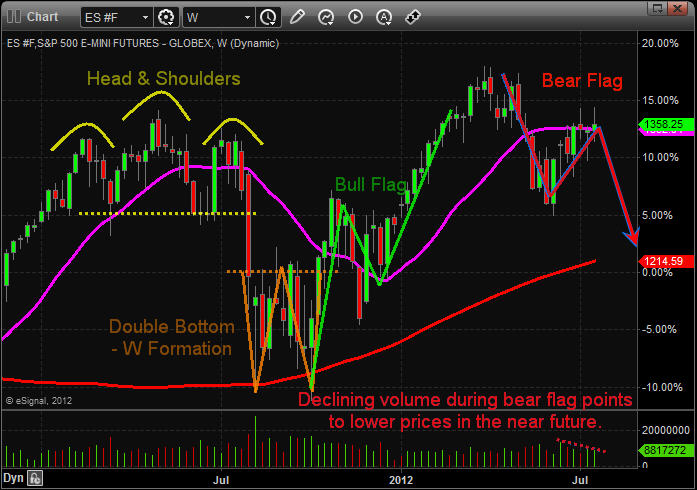
Chart Pattern Trading
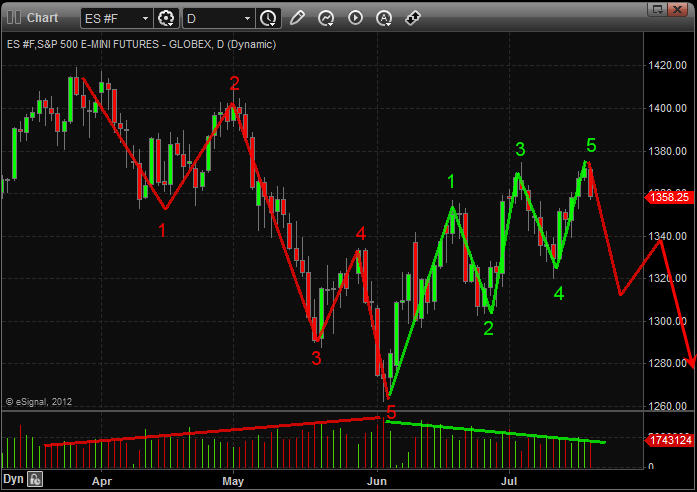
Daily Chart Elliott Wave Count For SP500
A second look at the S&P daily illustrates a down trend and 5 wave count bounce in the market, both are currently pointing to lower prices.
» Completion of two intermediate cycles within longer term 5 wave pattern
» Downwards wave one from April until beginning of June followed by wave 2 correction from June until present.
The wave two correction typically proceeds the longest wave, wave three, which is pointing towards a large move down (Note that in the first shorter term cycle the downwards wave three was the longest by far. We expect the same to be repeated in the longer term cycle.)
Elliott Wave Theory Chart Pattern Trading
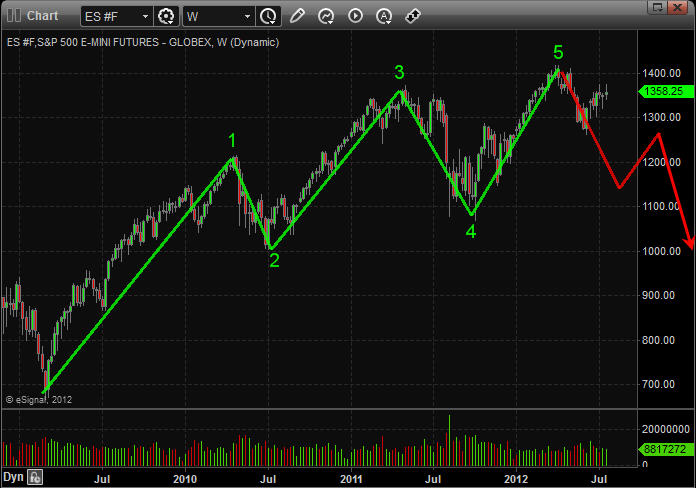
SP500 BIG PICTURE Wave Count
A look at the longer term view once again using the weekly chart, again supports our argument for a major correction. We have just completed a 5 wave pattern since the 2009 lows, and it is looking more like a big pull back is due. Remember most major trends end after the fifth wave.
Stock Market Elliott Wave Count Chart Pattern Trading
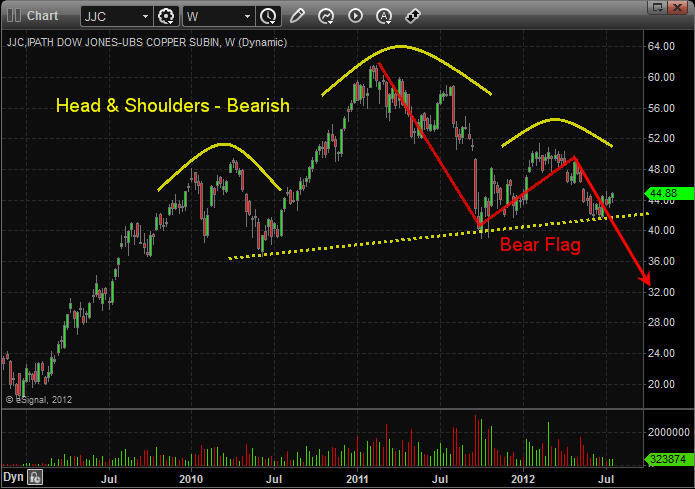
Copper Weekly Chart Patterns
If we take a look at the copper ETF, “JJC”, we are provided with further justification. Copper is often referred to as “Dr.Copper” due to its industrial application and is known to be a leading indicator for equity markets. Copper has significantly underperformed equity markets and is likely leading the next move down. A look at the weekly chart which points to a rather dismal outlook. There is a major head and shoulder patterns developing.
Copper Chart Pattern Trading
Major Market Pattern Analysis Conclusion:
Last summer turn into a bloodbath with nothing but red candlesticks taking stocks and commodities sharply lower. If you haven’t already, it’s time to lock in some profits. Short, intermediate, and long term cycles are pointing down, and the increasingly bearish technical developments cannot be ignored. We’ll be looking at entering multiple shorts potentially in the very near future once/if setups present themselves. Buckle up and stay tune for more…
Find out more on gold cycles and trading at www.GoldAndOilGuy.com
By Chris Vermeulen
Chris@TheGoldAndOilGuy.com
Please visit my website for more information. http://www.TheGoldAndOilGuy.com
Chris Vermeulen is Founder of the popular trading site TheGoldAndOilGuy.com. There he shares his highly successful, low-risk trading method. For 6 years Chris has been a leader in teaching others to skillfully trade in gold, oil, and silver in both bull and bear markets. Subscribers to his service depend on Chris' uniquely consistent investment opportunities that carry exceptionally low risk and high return.
This article is intended solely for information purposes. The opinions are those of the author only. Please conduct further research and consult your financial advisor before making any investment/trading decision. No responsibility can be accepted for losses that may result as a consequence of trading on the basis of this analysis.
© 2005-2022 http://www.MarketOracle.co.uk - The Market Oracle is a FREE Daily Financial Markets Analysis & Forecasting online publication.