


Takes A Global Recession To Reduce Gas Prices By Just 40 Cents!
Commodities / Gas - Petrol Jun 12, 2012 - 07:20 AM GMTBy: James_Quinn

 You can’t watch the mainstream media propaganda channels for more than ten minutes without a talking head breathlessly announcing that gas prices have dropped for the 24th day in a row and are now back to $3.55 a gallon. Wall Street oil analysts, who are paid hundreds of thousands of dollars per year to tell us why prices rose or fell after the fact, are paraded on CNBC to proclaim the huge consumer windfall from the drop in price. This is just another episode of a never ending reality show, designed to keep the average American sedated so they’ll continue to spend money they don’t have buying crap they don’t need. The brainless twits that pass for journalists in the corporate mainstream media never give the viewer or reader any historical context to judge the true impact of the price increase or decrease. The government agencies promoting the storyline of those in power extrapolate the current trend and ignore the basic facts of supply, demand, price and peak oil. The EIA is now predicting further drops in prices. Two months ago they predicted steadily rising prices through the summer. What would we do without these government drones guiding us?
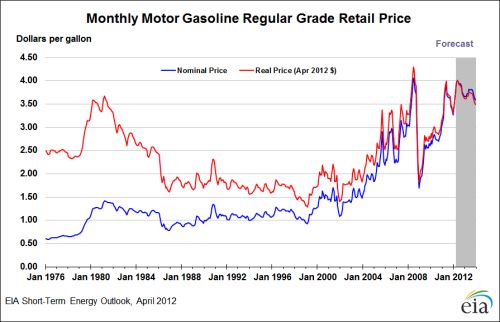
As you can see from the chart, gas prices tend to be volatile and unpredictable in the short term. You can also see that since 1998 the trend has been relentlessly higher. The average inflation adjusted price of gasoline in 1998 was $1.41 per gallon, versus $3.55 today, a 152% increase in fourteen years. Over this same time frame the BLS manipulated CPI was up only 44%. If we are swimming in oil, as the MSM pundits claim, why the tremendous surge in price? It must be those evil oil companies. It couldn’t possibly be the impact of peak oil. To acknowledge the fact that worldwide oil production has reached its peak would be to concede that our suburban sprawl, just in time world is drawing to an excruciating end. So the politicians spout their assigned storylines, supported by their paid off “experts” (aka Daniel Yergin), and unquestioningly reported as fact by their designated corporate media outlet. Those of a liberal bent assail oil companies and speculators; refuse to acknowledge the law of supply and demand, while touting green energy as the solution to all our energy needs. Those of a conservative bent believe in attacking foreign countries to secure “our” oil, refuse to acknowledge the law of supply and demand, and spout “drill, drill, drill” slogans because dealing with facts is inconvenient. The willfully ignorant public believes whichever storyline matches their preconceived beliefs. All is well – no one is required to think critically. Thinking is hard.
There are numerous factors that affect the price of oil on a daily basis, but at the end of the day supply and demand determine price. The chart below documents the key external events that have had a major impact on oil prices since 1970. The vital fact that you won’t hear on CNBC is that every recession since 1970 has been immediately preceded by an oil price spike. Anyone living in the real world (this excludes Cramer, Liesman, Bartiromo, & Kudlow) knows we have entered part two of the Greater Depression. The surge in oil prices in the last two years has precipitated this renewed downturn.
The MSM blathering baboons of bullshit dutifully report the price of gas on given day. People who live in the real world fill up their gas tanks every week, so the average price over a period of time is what matters. The average price of a gallon of gasoline in 2008 was $3.39. The average price in 2011 was $3.48. The average price in 2012 has been $3.62 thus far. This data paints an entirely different picture than the one painted by the politicians, experts and the clueless captured media. Gas prices are higher than they were prior to the last economic implosion. Cause and effect is a concept beyond the intellectual capabilities of MSM journalists and the millions of government educated zombies they mesmerize with misinformation. The lack of intellectual curiosity and critical thinking skills plays directly into the hands of those with a storyline to sell or truth to obscure.
Swimming in Oil
The recent storyline proliferated by the MSM at the behest of Washington DC politicians and the corporate interests that control them, is that the U.S. is on the verge of energy independence, with hundreds of years of plentiful oil right under our feet. The chart below made the rounds last week on Bloomberg, defender and mouthpiece of billionaires everywhere. This chart surely proves that peak oil is bullshit. Right?
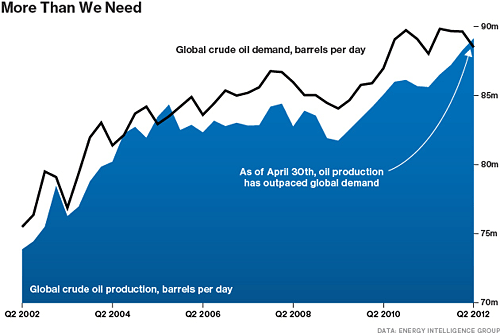
Besides the false representation of oil production and the misleading conclusion that we have more oil than we need, the chart and Bloomberg screed does not provide the true context of why worldwide demand is tumbling. The chart is NOT showing global crude oil production. It is showingglobal oil and other liquids supply, which includes crude and condensate, natural gas plant liquids, other liquids (mostly ethanol), and processing gains (increase in volume from refining heavy oil). The MSM would rather mislead the public than provide the true picture of the supposed oil production boom. The question is whether the MSM is misleading the public due to their own journalistic incompetence or are they carrying out their assigned mission on behalf of the corporate oligarchs running the kingdom.
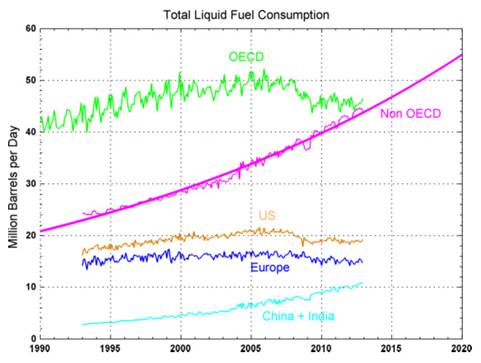
The chart below reveals a truer picture of the worldwide energy situation. Conventional oil production hit its peak/plateau around 74 million barrels per day at the end of 2004, and has barely budged from that level over the last eight years. Despite all the rhetoric about the North American oil boom, conventional oil production is at virtually the same level today as it was in 2004. The U.S.(shale oil) and Canadian (tar sands) gains in production have been matched by the collapse in Mexican production. The Middle East countries produced 23.3 million barrels in September 2004. The average price of a barrel of oil in 2004 was $38. They are now only producing 23.9 million barrels when prices are 120% higher.
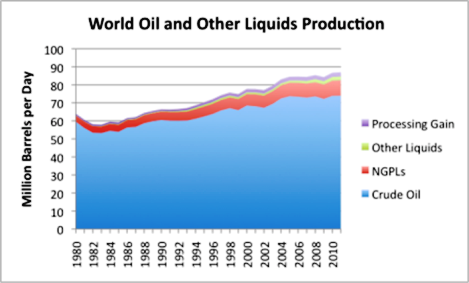
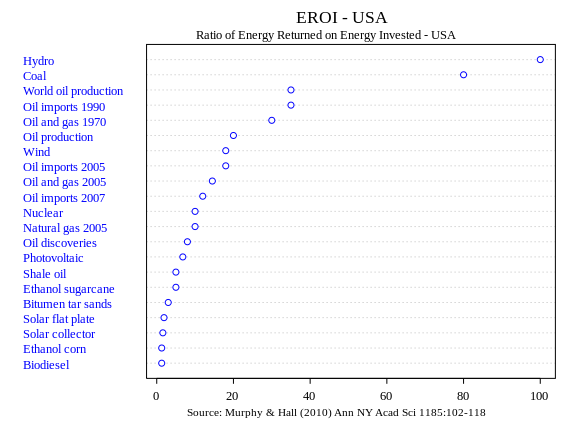
Global oil demand in 2004 was around 84 million barrels per day. To increase liquid fuel supply to meet the 90 million barrels per day demand we had to turn to unconventional fuels like tar sands, tight oil, and biofuels, all of which have far higher production costs and far less energy content than sweet crude. As the easy to access, cheap to produce ($20 per barrel in Saudi Arabia), close to the surface sweet crude has been depleted, it has been replaced by heavy crude, tar sands, deep-water oil, and shale oil, with production costs in excess of $80 per barrel. Anyone anticipating a long-term decline in fuel prices must be smoking tar sands in their bong. The liquids that have “replaced” conventional crude have a few slight drawbacks. Natural gas liquids provide about 70% as much energy per barrel as crude oil, so a barrel of NGL is not equivalent to a barrel of crude. Have you filled up your SUV lately with some NGL? Ethanol provides only 60% as much energy per barrel as crude oil and its EROEI is pitifully low. The energy returned on energy invested for these non-conventional sources of energy approaches the minimum limits unless prices rise dramatically. The Obama green army does not want this chart making its way into the public discourse. Their fantasyland of renewable energy solutions is proven to be a fool’s errand.
Catch-22 Energy Edition
The price of a barrel of West Texas crude is currently $86 per barrel, down from $109 per barrel in February. Obama supporters will proclaim that his threat to crack down on speculators had the desired effect. He must have scared those nasty speculators with his gravitas. The price rise surely didn’t have anything to do with the U.S. led attack on Libya, the act of war economic sanctions on Iran, the beating of Israel/U.S. war drums, Japan demand due to the shutdown of their nuclear power industry, or the relentlessly higher demand from China and India. And now the MSM is trying to spin a yarn that prices have dropped by 21% because worldwide supply is surging. That is so much more palatable than telling the truth and admitting that we’ve entered the 2nd phase of the Greater Depression.
It took $140 a barrel in oil in 2008 to tip the world into recession. Worldwide economies were much stronger then. The U.S. National Debt has risen by $6.5 trillion, or 70% since 2008. Real GDP has risen by $200 billion since 2008, or a 1.5% increase. Debt to GDP has risen from 64% to 102%. Consumer debt at $2.55 trillion is exactly the same as the 2008 level even after Wall Street banks have written off over $1 trillion, subsidized by the American taxpayer. The consumer deleveraging storyline is completely false. In 2008 there were 234 million working age Americans and 145 million of them were employed. Today there are 243 million working age Americans and 142 million of them are employed. In 2008 there were 28 million Americans in the food stamp program. Today there are 46 million Americans collecting food stamps. The economic situation in Europe has deteriorated at a far greater rate. Therefore, it is not surprising that it only took $109 a barrel oil to push the world back into recession.
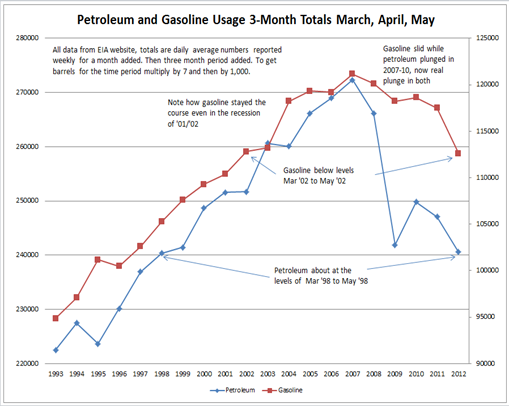
The main reason prices are dropping is the collapse in demand from Europe and the United States. The bumpy plateau of peak oil is in full force. Prices rise to the point where they push economies into recession, demand crashes due to the recession, and prices decline. The double whammy of oil prices reaching $111 a barrel in 2011 and $109 a barrel in 2012 have sapped the life out of the American consumer. This is reflected in the plunge in gasoline and petroleum usage since 2008, with a temporary leveling off in 2010, followed by a further nosedive since 2011. As this recession deepens over the next six months, prices will likely fall further. But this is where the Catch-22 kicks in.
Once prices drop below $80 a barrel it sets in motion a reduction in capital investment, as new production projects are not economically feasible below $80 per barrel. Oil analyst Chris Nedler explains the Catch-22 aspect of oil prices in a recent article:
Research by veteran petroleum economist Chris Skrebowski, along with analysts Steven Kopits and Robert Hirsch, details the new costs: $40 - $80 a barrel for a new barrel of production capacity in some OPEC countries; $70 - $90 a barrel for the Canadian tar sands and heavy oil from Venezuela’s Orinoco belt; and $70 - $80 a barrel for deep-water oil. Various sources suggest that a price of at least $80 is needed to sustain U.S. tight oil production.
Those are just the production costs, however. In order to pacify its population during the Arab Spring and pay for significant new infrastructure projects, Saudi Arabia has made enormous financial commitments in the past several years. The kingdom really needs $90 - $100 a barrel now to balance its budget. Other major exporters like Venezuela and Russia have similar budget-driven incentives to keep prices high.
Globally, Skrebowski estimates that it costs $80 - $110 to bring a new barrel of production capacity online. Research from IEA and others shows that the more marginal liquids like Arctic oil, gas-to-liquids, coal-to-liquids, and biofuels are toward the top end of that range.
My own research suggests that $85 is really the comfortable global minimum. That’s the price now needed to break even in the Canadian tar sands, and it also seems to be roughly the level at which banks and major exploration companies are willing to commit the billions of dollars it takes to develop new projects.
Oil prices may temporarily drop below $80, but prices below that level for a prolonged period will lead to supply being constricted, which will ultimately lead to higher prices. The storyline of hundreds of years of Bakken shale oil that will make the U.S. energy independent is the latest fiction to be peddled by the oligarchs as a way to sedate and confuse the masses.
What the Frack
U.S. oil production in 2007 averaged 8.5 million barrels per day. Today, the U.S. is producing 10.7 million barrels per day. We must have hit the jackpot. Not quite. Actual crude oil production has increased by 1 million barrels per day, a 20% increase. The other 1.2 million barrels have been from liquefied natural gas (up 34%) and government subsidized ethanol (up 100%).
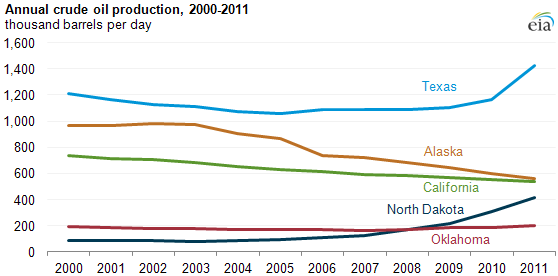
The U.S. crude oil production is at the same level it was in 1998, but somehow we are on the verge of becoming energy independent. The recent increase is solely due to the horizontal drilling and hydraulic fracturing of shale deposits in Texas and North Dakota. You don’t hear much about Alaskan production declining for the ninth year in a row and California production declining to the lowest level in three decades. The paid shills predicting Bakken production of 3 million barrels per day are purposely lying or just plain delusional.
North Dakota oil production has reached 550,000 barrels per day versus 187,000 barrels per day in 2009. Simpletons in the MSM will just extrapolate this growth to 3 million barrels by 2020. No need to examine the facts. Oil market expert Tom Whipple reveals the dirty secrets behind the Bakken shale oil miracle:
It took the production from 6,617 wells to produce North Dakota's 546,000 b/d in January. Divide the daily production by the number of wells and you get an astoundingly low 82 b/d from each well. I say "astounding" because a good new offshore well can do 50,000 b/d. BP's Macondo well which exploded in the Gulf a couple of years ago was pumping out an estimated 53,000 b/d before it was capped.
Now a North Dakota shale oil well is not in the cost class of a deep-water offshore platform which can run into the billions, but they do cost about three times as much as a classic onshore oil well as they first must be drilled down 11,000 feet and then 10,000 horizontally through the oil bearing layer before the fracturing of the rock can take place. The "fracking" involves at least 15 massive pumps that inject water and other chemicals into the well. Take a Google Earth flight over northwestern North Dakota. The fracked wells are hard to miss as there are now about 9,000 of them and they are each the size of a football field.
There is still more -- fracked wells don't keep producing very long. Although a few newly fracked wells may start out producing in the vicinity of 1,000 barrels a day, this rate usually falls by 65 percent the first year; 35 percent the second; and another 15 percent the third. Within a few years most wells are producing in the vicinity of 100 b/d or less which is why the state average for January is only 82 b/d despite the addition of 1300 new wells in 2011.
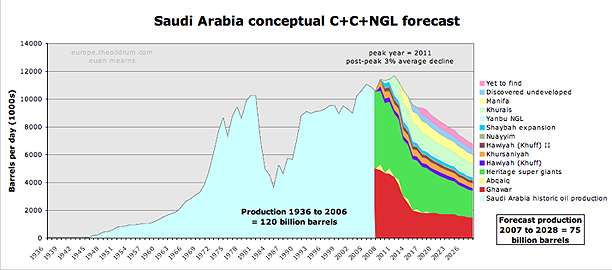
The rapid depletion of these wells, enormous expense to drill new wells, oil prices barely above cost of production, low EROEI, swiftly falling Alaskan and shallow water production, and the snail’s pace of deep water production are not a recipe for energy independence. Shale oil production will never exceed 1 million barrels per day. And if you believe Saudi Arabia’s promises to fulfill any shortfalls, I’ve got some delightful beachfront property in Afghanistan to sell you. Saudi conventional crude oil production is at the same level it was in 2005.
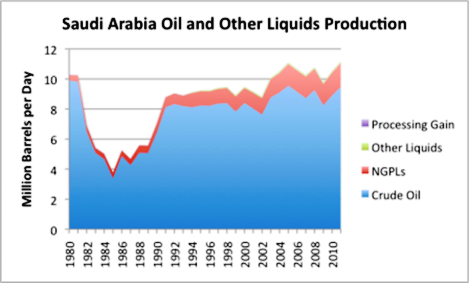
The seven year Saudi plateau is just a precursor to what is going to happen over the next decade. Saudi Arabia began pumping oil in 1945. It will all be gone by 2045. You can’t extract an infinite amount of oil from a finite world. Pretending this isn’t true won’t make it so. Oil has been the lifeblood of our nation since the late 1800s. The depletion of this essential ingredient of the modern world will not lead to a sudden death for our way of life but a slow downward spiral of waning supply, escalating prices, and economic decay.
The sustained high and rising oil prices will be economically destructive as our debt saturated, suburban sprawl, mall centric, SUV crazed, cheap oil dependent society methodically and agonizingly implodes. Chris Skrebowski describes our future succinctly:
“Unless and until adaptive responses are large and fast enough to constrain the upward trend of oil prices, the primary adaptive response will be periodic economic crashes of a magnitude that depresses oil consumption and oil prices.”
We’ve entered one of these periodic economic crashes. They are coming faster and faster. So enjoy that 40 cent drop in gas prices as you drive down to sign up for food stamps. The Saudis have a saying that acknowledges their luck in being born on top of billions of barrels of oil and the inevitability of its depletion:
“My father rode a camel, I drive a car, my son flies a jet plane, his son will ride a camel.”
Delusional Americans believe they have a right to cheap plentiful oil forever. They refuse to acknowledge that luck has played the major part in their rise to economic power. The American saying will be:
My great grandfather rode a horse, my grandfather drove a Model T, my father drove a Buick, I leased a Cadillac Escalade, my son died in the Middle East fighting for my oil, his son will never be born.Join me at www.TheBurningPlatform.com to discuss truth and the future of our country.
By James Quinn
James Quinn is a senior director of strategic planning for a major university. James has held financial positions with a retailer, homebuilder and university in his 22-year career. Those positions included treasurer, controller, and head of strategic planning. He is married with three boys and is writing these articles because he cares about their future. He earned a BS in accounting from Drexel University and an MBA from Villanova University. He is a certified public accountant and a certified cash manager.
These articles reflect the personal views of James Quinn. They do not necessarily represent the views of his employer, and are not sponsored or endorsed by his employer.
© 2012 Copyright James Quinn - All Rights Reserved
Disclaimer: The above is a matter of opinion provided for general information purposes only and is not intended as investment advice. Information and analysis above are derived from sources and utilising methods believed to be reliable, but we cannot accept responsibility for any losses you may incur as a result of this analysis. Individuals should consult with their personal financial advisors.
James Quinn Archive |
© 2005-2022 http://www.MarketOracle.co.uk - The Market Oracle is a FREE Daily Financial Markets Analysis & Forecasting online publication.