


Stock Market Downtrend May be Ending Soon
Stock-Markets / Stock Markets 2012 May 20, 2012 - 09:45 AM GMTBy: Tony_Caldaro

 A nasty week in most of the world’s stock markets as the current downtrend extended. The SPX/DOW lost 3.9%, the biggest weekly drop since November, and the NDX/NAZ lost 5.3%. Asian markets were -4.0%, European markets were -5.0%, and the DJ World index lost 5.4%. Economic reports for the week were mixed with negatives edging out positives 7 to 6. On the uptick: the NY FED, the NAHB, housing starts, industrial production, capacity utilization, and the WLEI. On the downtick: retail sales, the CPI, business inventories, building permits, the Philly FED, leading indicators, and jobless claims rose. Next week we will get a look at more housing data, durable goods orders and consumer sentiment. Best to your week!
LONG TERM: bull market
Despite the US market doubling between 2009 and 2011, and making new highs in 2012, this has not been a steady uptrending bull market. Unlike the steady 2002-2007 bull market, see weekly chart below, this one has run into four straight spring swoons to the downside in the past four years. The first one started at the end of the first bull market uptrend, in June 2009. It ended with a 9.1% correction. The second started with the conclusion of Major wave 1 of Primary I, in April 2010. It ended with a 17% correction. The third one started at the conclusion of Primary I, May 2011. It ended with a 22% correction. This fourth one started this April, and has thus far corrected 9.1%. Notice the Jun09 correction was also 9.1%, as was the Jan10 correction. In fact, the 9.1% correction level has marked the end of two of this bull market’s six corrections. The other two, not mentioned, were the Feb11 7.4% and Oct11 10.4% corrections. These are noted on the weekly chart.
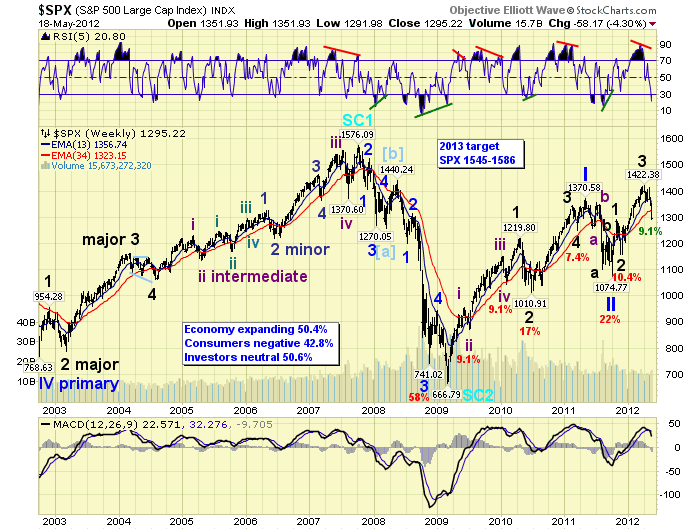
Our long term count from the Mar09 bear market low at SPX 667 remains unchanged. We counted five Major waves up to SPX 1370 in May11, ending Primary wave I. Then an elongated flat to SPX 1075 into Oct11, ending Primary wave II. Primary wave III has been underway since then. After this week’s market action, however, our Primary wave III count has come under some pressure. The slight dip on friday to SPX 1292 momentarily overlapped the previous uptrend high of 1293. On thursday we considered this possibility when we noted there were a few additional potential counts if it occurred.
MEDIUM TERM: downtrending
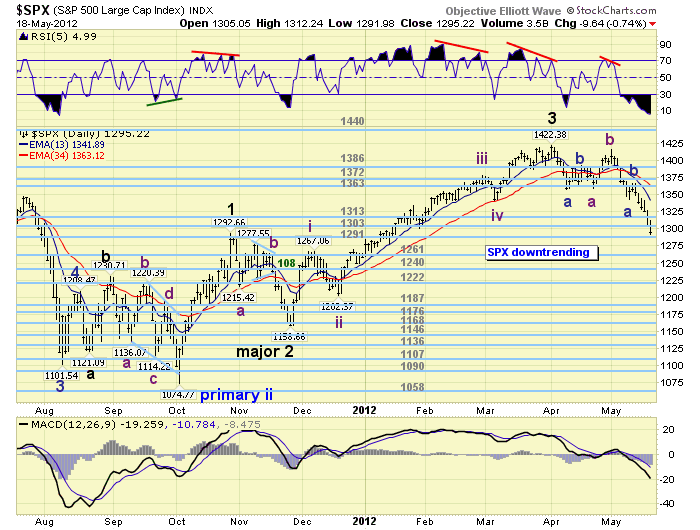
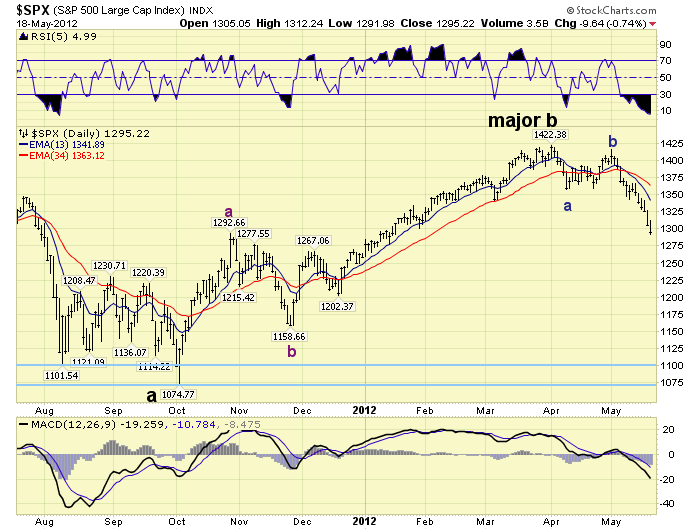
Currently we are maintaining the Major 1-2-3-4 count posted on the daily chart below. Should the DOW overlap its previous uptrend as well, remember the DOW is the bellwether, then the count will likely require adjustment.
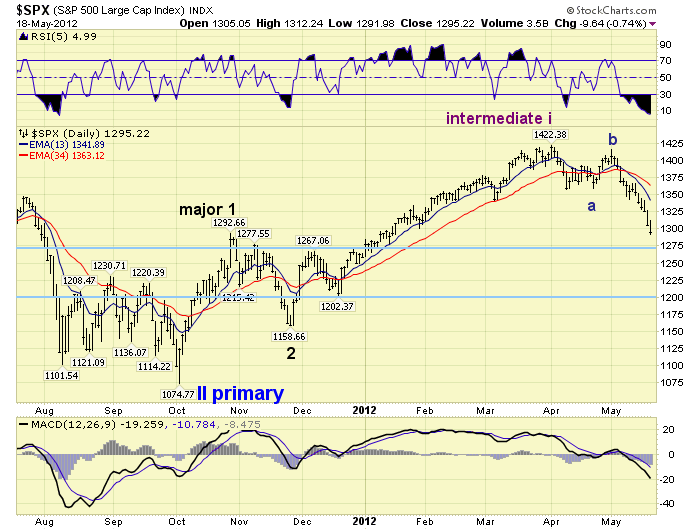
The first alternate count is the most obvious. Primary wave II ended in Oct11 at SPX 1075. Then Major wave 1 and 2 ended at SPX 1293 and 1159 respectively, and the recent uptrend was Intermediate wave i of Major 3 ending at 1422. Intermediate wave ii would be under way now. This would suggest a, worse case, decline into the SPX 1202-1267 area.
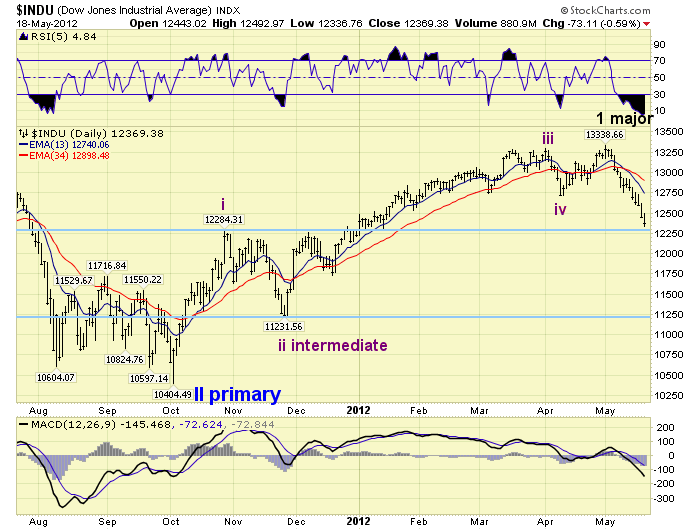
The second alternate count is suggested by the bellwether DOW. Again Primary wave II ended in Oct11. Then the market rallied five waves up from that low, in Intermediate waves (i-ii-iii-iv-v), to complete Major wave 1 of Primary III. Remember the DOW had five trend changes, waves, from the Primary II low into its May12 high. This would suggest a, worse case, decline into the DOW 11,232-12,284 and SPX 1159-1293 area.
The third alternative, and least preferred, suggests only Major wave A of Primary II completed in Oct11 at SPX 1075. The advance from that low was an abc Major wave B of Primary II. Major wave C would now be underway to retest that low, and complete Primary II. This would suggest a, worse case, decline into the SPX 1075-1100 area or lower. Certainly this is the worse case scenario.
Keep in mind the overlap that would trigger one of these three alternate counts has not occurred yet. If it does, and considering the current state of the foreign and commodity markets, we would place a 40% probability on each of the first two counts and a 20% probability on the last count. This has been an historically difficult bull market. Should this correction extend into June, we would prefer the DOW count. During this bull market corrections to Major waves or larger have taken from 1 – 5 months, while smaller waves have only taken one month. These charts are all posted at the very end, page 17, of the public stockcharts … link below.
SHORT TERM
Support for the SPX is at the 1291 and 1261 OEW pivots, with resistance at the 1303 and 1313 pivots. Short term momentum is starting to display a positive divergence. The short term OEW charts remain on a negative bias from SPX 1395, with the positive swing level now in the mid 1330′s.
This correction, needless to state, has declined slightly more than our SPX 1300 – 1340 general range, and much more than our SPX 1313 – 1327 expected range. Medium and long term momentum is now at its lowest level since August 2011. The last time the market had this type of selling pressure (2011) it rallied over 100 SPX points in just six trading days. The two previous times, during this bull market, it rallied 90 points in 6 trading days (2010), and 100+ points in 8 trading days (2009).
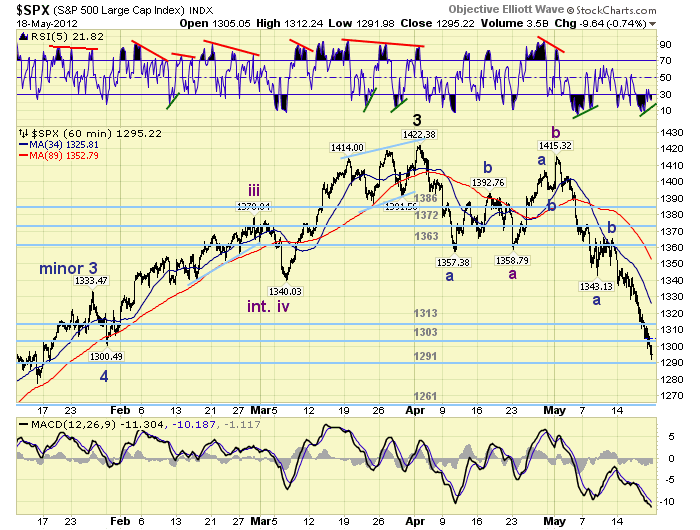
Remaining with our posted count. It appears this correction has an Intermediate wave A flat followed by an Intermediate wave C zigzag. The wave relationships from the SPX 1422 uptrend high are displaying some equality. Minor a of Int. A dropped 65 points, SPX 1422-1357. Now Minor A and C of Int. C have declined 72 and 74 points respectively. In fact, the total decline for Int. C = 2 x Int. A between SPX 1285 and 1289.
When examining the internal wave structure of the declines we find Minor a of Int. A was a simple 7 waves, and Minor a of Int. C was also a simple 7 waves. Minor c of Int C, however, has recently extended to 13 waves. This is an incomplete corrective wave and needs at least one more small rally and decline. The SPX 1285-1289 area would fit quite nicely for a low.
From a fibonacci perspective SPX 1291 represents a 50% retracement of the entire uptrend from 1159-1422. The next retracement support would be the 61.8% level or SPX 1259. Both of these levels are at the support pivots: 1291 and 1261. Heading into next week, if the OEW 1291 pivot range, (SPX 1284-1298), does not hold the market is likely heading toward the 61.8% retracement level at the 1261 pivot range. Best to your trading!
FOREIGN MARKETS
The Asian markets were all lower on the week losing 4.0%. Only China, of the 8 indices we track, remains in an uptrend.
The European markets were also all lower on the week losing 5.0%. All 7 indices we track are in downtrends.
The Commodity equity group all fell as well losing 7.8% on the week. All 3 indices we track are in downtrends.
The DJ World index continues to downtrend and lost 5.4% on the week.
COMMODITIES
Bonds continue to uptrend, gaining 0.6%, as the 10yr Bond made a new all time high. Ten year yields are near all time lows of 1.696%. The 30yr is approaching 2011 levels 2.694%.
Crude continues to downtrend, losing 4.4% on the week. The recent market action here looks quite similar to the spring of 2009, 2010, and 2011. Those declines were 21%, 23% and 34% respectively as noted on the weekly chart, page 9. The current decline is 18%.
Gold had a wild week. After being down over $50 it rallied to end the week with a 0.6% gain. The downtrend may have bottomed at wednesday’s $1527 low, after hitting its most oversold medium and long term level since 2008.
The USD continues to uptrend gaining 1.3% on the week. The downtrending EUR lost 1.1%, while the uptrending JPY gained 1.2%.
NEXT WEEK
A light calendar ahead, economically, kicks off on tuesday with Existing home sales. On wednesday New home sales and the FHFA housing index will be reported. Thursday weekly Jobless claims and Durable goods orders. Then on friday Consumer sentiment. The FED has nothing scheduled ahead of the Memorial day holiday next monday. Best to your weekend and week!
CHARTS: http://stockcharts.com/...
http://caldaroew.spaces.live.com
After about 40 years of investing in the markets one learns that the markets are constantly changing, not only in price, but in what drives the markets. In the 1960s, the Nifty Fifty were the leaders of the stock market. In the 1970s, stock selection using Technical Analysis was important, as the market stayed with a trading range for the entire decade. In the 1980s, the market finally broke out of it doldrums, as the DOW broke through 1100 in 1982, and launched the greatest bull market on record.
Sharing is an important aspect of a life. Over 100 people have joined our group, from all walks of life, covering twenty three countries across the globe. It's been the most fun I have ever had in the market. Sharing uncommon knowledge, with investors. In hope of aiding them in finding their financial independence.
Copyright © 2012 Tony Caldaro - All Rights Reserved Disclaimer: The above is a matter of opinion provided for general information purposes only and is not intended as investment advice. Information and analysis above are derived from sources and utilising methods believed to be reliable, but we cannot accept responsibility for any losses you may incur as a result of this analysis. Individuals should consult with their personal financial advisors.
© 2005-2022 http://www.MarketOracle.co.uk - The Market Oracle is a FREE Daily Financial Markets Analysis & Forecasting online publication.