


Is the World coming to an End? Stock Market MAP Waves Theory Explained, Part 3
InvestorEducation / Technical Analysis May 07, 2012 - 08:45 AM GMTBy: Marc_Horn

 In MAP Waves Part 1 I presented my methodology. In MAP Waves Part 2 I presented probabilities as a simple foundation for a very basic explanation of wave theory so that you can start to visualize what is happening in the stock market and to better understand trading patterns in the context of MAP waves.
Basic Wave theory
Being a strong believer if the KISS principle - grossly simplified for explanation purposes that everyone should be able to relate to;
A wave is a transfer of energy in multiple dimensions - we only need 2 - amplitude and frequency. Amplitude we see as price action and frequency as time - but the beauty of this explanation is that any one of use can see it on a stock chart!
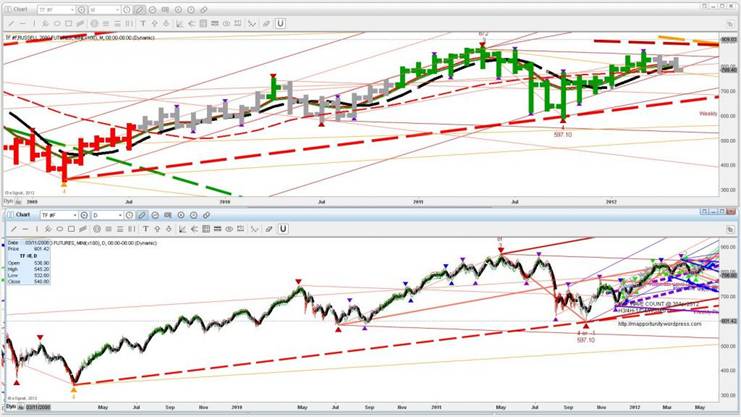
Now if we have multiple waves - different chart bar scales, we can see that we have waves within waves! Examples of this are shown in Part 1 and Part 2, and again we can go back to simple wave theory which says the resultant wave will have both dimensions of amplitude and frequency changed, basically the sum of the components of amplitude and frequency when waves meet at a point in time, forming a more complex wave shape which for our purposes again can be seen by using the same SMA over 2 time periods, where the shorter time period becomes much more wavy as shown in the charts below.
I think it is pretty obvious and needs no more explanation at this point and will be discussed in Part 4 where I will discuss basic EW trading principle, simplified to my basic understanding level!
From now on I want you to visualise waves within waves, within waves and you are trying to make this into useful information! In part 2 I showed you this even applies if you use 1 minute bars!
Using this basic simple information we will then look for explanations of those technical expert analysts terms like Head and shoulders, bull flags, bear flags, zigzag or simple corrections, flat corrections, rising or falling wedges, triangle corrections, expanding pivots or as I prefer to call them - BULLS$%^ BAFFLES BRAINS. Here I will offer explanations of these terms in the context of MAP waves to give a better understanding of the formations in order to make more informed investment decisions.
As my basis of this part of the discussion I have used eSignal's Advanced GET Elliot Wave description document (I am purely stating that in the hope that by giving them credit where it is due that I will not be sued for copyright and NOT as an advert for their system), and added in the MAP Waves explanations where appropriate in red.
Elliott Wave Theory is a collection of complex techniques. Approximately 60 percent of these techniques are clear and easy to use. The other 40 percent are difficult to identify, especially for the beginner. The practical and conservative approach is to use the 60 percent that are clear. When the analysis is not clear, why not find another market that is conforming to an Elliott Wave pattern that is easier to identify? From years of fighting this battle, we at Advanced GET have come up with the following practical approach to using Elliott Wave principles in trading. The whole theory of Elliott Wave can be classified into two parts:
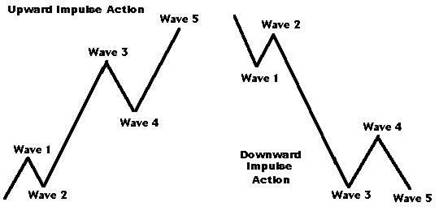
1 - Impulse Patterns
The impulse pattern consists of five waves. The five waves can be in either direction, up or down. Some examples are shown here. The first wave is usually a weak rally with only a small percentage of the traders participating. Once Wave 1 is over, traders sell the market on Wave 2. The sell-off in Wave 2 is very vicious. Wave 2 will finally end without making new lows, and the market will start to turn around for another rally.
The initial stages of the Wave 3 rally are slow, and it finally makes it to the top of the previous rally (the top of Wave 1). At this time, there are a lot of stops above the top of Wave 1.
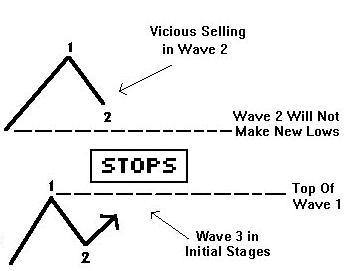
Traders are not convinced of the upward trend and are using this rally to add more shorts. For their analysis to be correct, the market should not take the top of the previous rally.
Therefore, many stops are placed above the top of Wave 1.
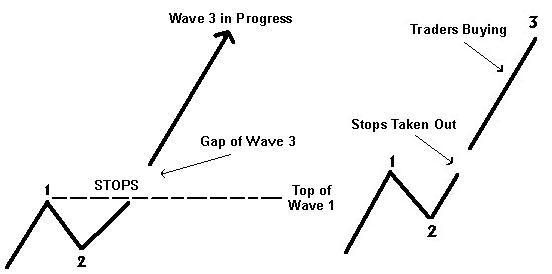
The Wave 3 rally picks up steam and takes the top of Wave 1. As soon as the Wave 1 high is exceeded, the stops are taken out. Depending on the number of stops, gaps are left open. Gaps are a good indication of a Wave 3 in progress. After taking the stops out, the Wave 3rally has caught the attention of traders.
The next sequence of events is as follows: Traders who were initially long from the bottom finally have something to cheer about. They might even decide to add positions.

The traders who were stopped out (after being upset for a while) decide the trend is up, and they decide to buy into the rally. All this sudden interest fuels the Wave 3 rally. This is the time when the majority of the traders have decided that the trend is up. Finally, all the buying frenzy dies down. Wave 3 comes to a halt. Now profit-taking begins to set in. Traders who were long from the lows decide to pull out. They have a good trade and start to protect profits. This causes a pullback in the prices that is called Wave 4.
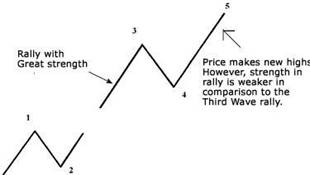
Where Wave 2 was a vicious sell-off, Wave 4 is an orderly profit-taking decline. While profit taking is in progress, the majority of traders are still convinced the trend is up. They were either late in getting in on this rally, or they have been on the sidelines. They consider this profit-taking decline an excellent place to buy in and get even. On the end of Wave 4, more buying sets in and the prices start to rally again. The Wave 5 rally lacks the huge enthusiasm and strength found in the Wave 3 rally. The Wave 5 advance is caused by a small group of traders. While the prices make a new high above the top of Wave 3, the rate of power, or strength, inside the Wave 5 advance is very small when compared to the Wave 3 advance. Finally, when this lackluster buying interest dies out, the market tops out and enters a new phase.
Down impulse waves are exactly the opposite as described with the psychology reversed. They happen much quicker as fear is generated and panic often takes over! Also if we look from economics basic supply and demand theory - when demand is higher, price increases as there is fixed supply, and vice a versa, when supply is higher prices decrease as there is a fixed supply!
2 - Corrective Patterns
Corrections are very hard to master. Most Elliott traders make money during an impulse pattern and then lose it during the corrective phase. An impulse pattern consists of five waves. A corrective pattern (with the exception of the triangle pattern) consists of 3 waves. An Impulse pattern is always followed by a Corrective pattern. Corrective patterns can be grouped into two categories: (1) Simple and (2) Complex.
We have seen in part 1 and Part 2 that depending on the bar scale you use, over 80% of waves are impulsive!
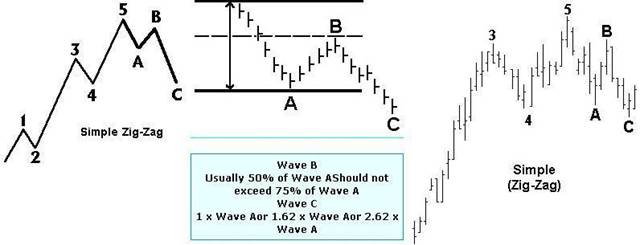
1. Simple Corrections
There is only one pattern in a simple correction. This pattern is called a Zigzag correction. A Zigzag correction is a three-wave pattern in which the Wave B does not retrace more than 75 percent of Wave A. Wave C will make new lows below the end of Wave A. The Wave A of a Zigzag correction always has a five-wave pattern. In two of the three types of complex corrections (Flat and Irregular), the Wave A has a three-wave pattern. Thus, if you can identify a five-wave pattern inside Wave A of any correction, you can then expect the correction to be a Zigzag formation.
See MAP Waves Part 1 and MAP Waves Part 2 where the probabilities of 3 wave versus 5 wave corrections are shown on different time scales.
2. Complex Corrections (Flat, Irregular, Triangle)
The complex correction group consists of 3 patterns: (1) Flat, (2) Irregular, and (3) Triangle.
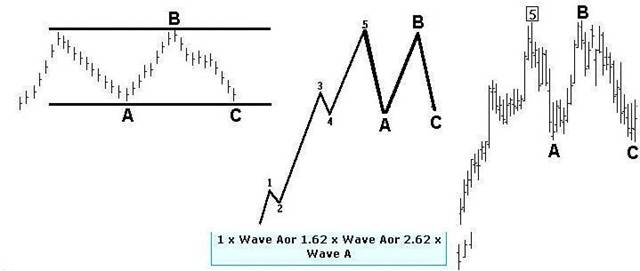
Flat Correction-- In a flat correction, the length of each wave is identical. After a five-wave impulse pattern, the market drops in Wave A. It then rallies in a Wave B to the previous high. Finally, the market drops one last time in Wave C to the previous Wave A low.
Irregular Corrections-- In this type of correction, Wave B makes a new high. The final Wave C may drop to the beginning of Wave A or below it.
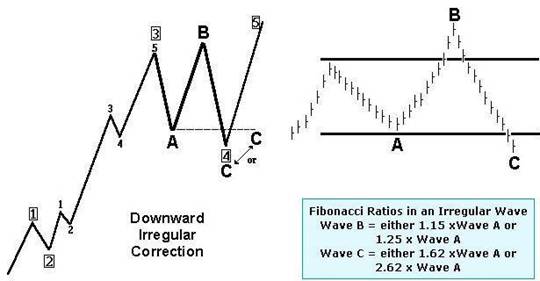
Using MAP Waves this indicates that A is 4, B is 5 of the next bigger level sub wave of which C is pivot 4, and 5 is the next bigger sub wave. So it is highly unlikely if this wave starts at the bottom that this would be the final top!
Triangle Corrections-- In addition to the three-wave correction patterns, there is another complex corrective pattern that appears time and time again. It is called the triangle pattern. The Elliott Wave Triangle approach is quite different from other triangle studies. The five sub-waves of a triangle are designated A, B, C, D and E in sequence.
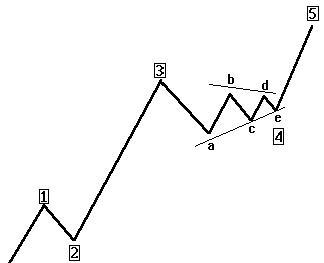
Triangles are, by far, most common as fourth waves. One can sometimes see a triangle as the Wave B of a three-wave correction. Triangles are very tricky and confusing. One must study the pattern very carefully prior to taking action. Prices tend to shoot out of the triangle formation in a swift thrust.
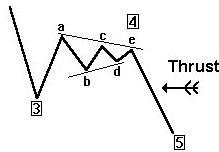
When triangles occur in the fourth wave, the market thrusts out of the triangle in the same direction as Wave 3. When triangles occur in Wave Bs, the market thrusts out of the triangle in the same direction as the Wave A.
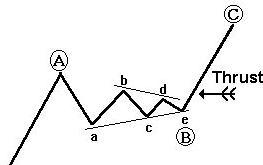
The reason for this thrust is that sub waves are present, a is pivot 2 (A=1) or 4 (A=3), b and c are sub wave pivots 1 and 2, and d and e are sub sub wave pivots 1 and 2, and this means that there very likely will be extensions in the next wave and this is why normally from this pattern you will see a strong thrust! If there is no strong thrust the opposite formation will develop to uncoil the spring energy built up here!
The Alteration Rule
If Wave 2 is a simple correction, expect Wave 4 to be a complex correction. If Wave 2 is a complex correction, expect Wave 4 to be a simple correction.
The law of alteration causes some real problems. I have not found a reliable way of predicting this and the reason is simple - however I have a way of setting trading parameters to manage risk! From my description of wave theory - I stated the sum of the interaction at a point in time. So let us start with an amplitude of 1. If we go half the pivot scale down let us pretend the amplitude is halved. Let us halve it again and again - so that we have 4 waves meeting. What would the expected limits of the pivots be? 1+0.5+0.25+0.125= 1.825 being the maximum sum if they are all at their peak when they meet, and 1-0.5-0.25-0.125=0.125. That is a huge range! 0.125 to 1.825 and anywhere in between if they are not at their extremes! (I am not suggesting that these ratios are correct, but just demonstrating the theory) I certainly am not surprised the that there would be a big variation with a high probability of having matching pivots which would at a quick glance would question how on earth can one determine which wave 2 and 4 pairs go together! THERE WILL ALWAYS BE A BULLISH AND BEARISH SCENARIO AS ANY PIVOT PAIR COULD BE ONE SCALE UP OR DOWN AND THIS IS THE BIGGEST DANGER OF USING EW IN ISOLATION, however from what we have seen in part 1 and 2 is that we can mange our risk by clearly understanding the probabilities on the investment scale we have - i.e am I a buy and hold for 25 years, 1 year, 1 month, 1 week, 1 day or a day trader! You must understand you investment horizon! That will give you your entry and exit points. Understanding the expected trading range will control your natural panic instinct! I cannot over emphasize this! In part 4 we will see how this might be managed.
From the analysis in part 1 and 2 I get the following probability distribution which you can verify yourself.
The result of the law of alternation is that you will see distinctive pattern formations which are discussed below, and when we discuss the trading principles you will understand where the alternate wave target line, as well as a normal wave target line comes from!
Other trading patterns explained by MAP Waves.
Rising or falling Wedge or Pennant or expanding pivot formations.
If pivots are alternating as described above then a wedge pattern will form if wave 2 is complex and 4 simple as shown below on 2 time scales - blue 4Hourly pivots and the possibility of daily - purple pivots.
The opposite pattern will occur if wave 2 is the alternate simple wave, but worse how the hell do we decide if we only have 1?? That is why we need alternate target lines which will be discussed in the next part so we can establish entry and exit parameters with our probabilities!
Head and Shoulders, Triple and Double tops and Bottoms
Again with MAP Waves very clearly explained as seen below. The Same is true on most pivot scales! A triple top or bottom is also commonly used. A Double top or bottom is formed when one either wave 5 or -1 has a sub wave, or in an inverted head and shoulders waves -5 or 1 have a sub wave!
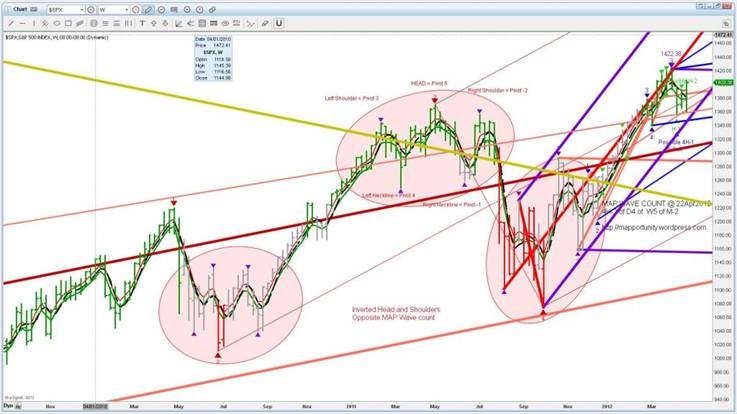
If you look at many chart on a longer timescale - on daily, weekly and even monthly pivot scales you can clearly see we are approaching some pretty big head and shoulders patterns! Scary if you are on the wrong side of the market!!
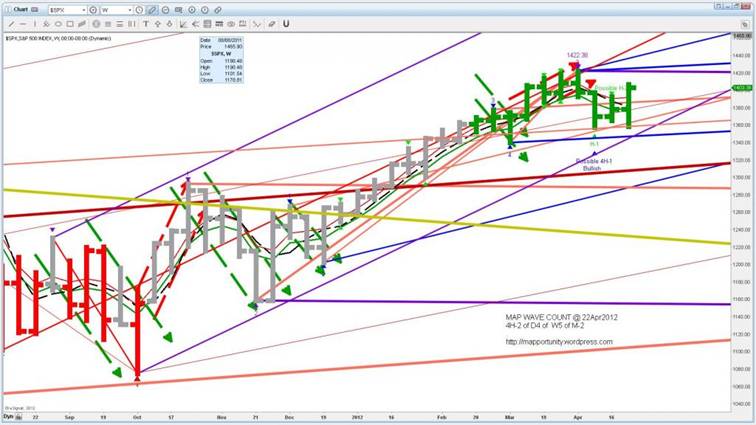
Bull and Bear Flags
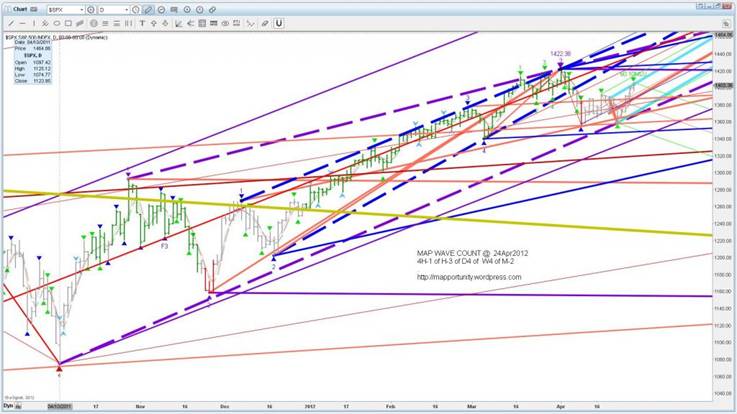
These are 01234 wave formation where waves 2 and 4 are equal in size (as opposed to the rule of alteration described above). Below I show them on the S&P on a small and big picture view as arrow pairs - bear flags red, bull flags green.
This can be seen on a bigger pivot scale below and shows that there is an extremely high probability that we are nearing then end of the upwave on the monthly pivot scale, and technically may have seen the final high for a long time conforming to my MAP Waves. On smaller time scales however I still feel we have a final high to come later this year but that analysis is for another day - try it for yourself to practice waves within waves! CAN YOU SEE THE MASSIVE BEAR FLAG?
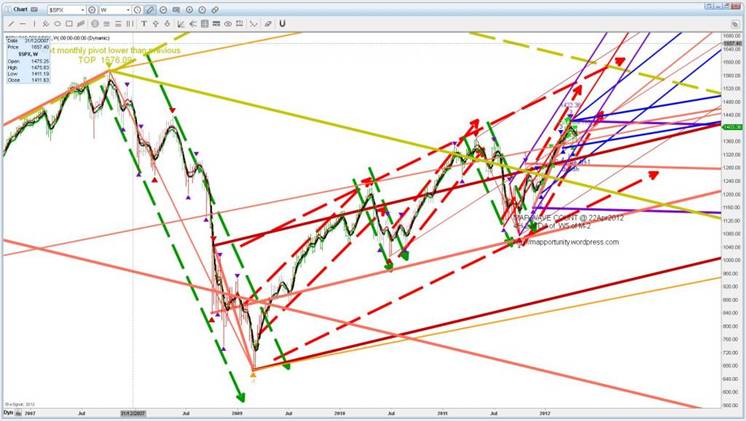
On the above chart we can clearly see a 5 wave formation where we have fulfilled the 5 wave validation criteria on that pivot scale off the 2009 bottom! Also here we have a reverse wedge formation - wave 2 is simple and wave 4 is complex – the law of alteration!
One of my trading rules is DO NOT TRADE HOT TIPS OR OTHER PEOPLES INFORMATION. I have intentionally mislead you into thinking MAP Waves was something new. It is purely the work of Ralph Nelson Elliot who called them MOTIVE WAVES which can go up and down! Have you heard of motive waves? How often have you heard EW specialists say that a wave formation has met the criteria of motive waves but no impulsive waves?
What really amazes me the most though is that despite the many readers of which I imagine there may have been one or two EW specialist, of Part 1 and Part 2 - NO ONE HAS COMMENTED ON THIS!
In Part 2 I said "Remember the world was once flat!" It is about perspectives and a willingness to have an open mind, and evaluate for yourself!
From what you have seen so far using your own simple analytical skills you can now come up with better investment risk assessments than the majority of EW specialists! Simply how can you decide if the market is going up or down if you have endless corrections? You may as well flick a coin and save your money on expert advice that ALLWAYS has a cop out clause - the correction is not over! Like me you too probably are thinking to yourself but the market has gone up by 25% How can we be in a correction??????
Where is the duty of care of professional advice?
There are many free useful explanations of trading EW as well as pitchfork analysis on the internet, and many of you may be familiar with some. I hope I have shed some light on the mystique of EW - give it a try using the pivot identification methodology described, starting big and moving to a smaller scale. You will be amazed!
In Part 4 I will explain basic trading EW and pitchforks and offer my interpretation with explanation and some cool tricks - MAP Analysis! BUT PLEASE BE WARNED - PIVOT SELECTION IS CRITICAL and I have a few ways of helping with high probability where pivots may fall.
I am reading many heading lines the end is near! Using the above techniques you can clearly see many head and shoulders patterns developing through the world markets on various time scales - you now have the tools to see this yourself, but be objective - just because it meets EW rules on a monthly pivot scale which many already do, many have even reached it on a weekly pivot scale, but that does not mean we have necessarily seen the final top – remember waves within waves within waves!
For more information of how I do what I do http://mapportunity.wordpress.com/ . Comments and discussions very welcome!
The statements, opinions and analyses presented in this site are provided as educational and general information only. Opinions, estimates, buy and sell signals, and probabilities expressed herein constitute the judgment of the author as of the date indicated and are subject to change without notice.
Nothing contained in this site is intended to be, nor shall it be construed as, investment advice, nor is it to be relied upon in making any investment or other decision.
Prior to making any investment decision, you are advised to consult with your broker, investment advisor or other appropriate tax or financial professional to determine the suitability of any investment.
© 2012 Copyright Marc Horn - All Rights Reserved Disclaimer: The above is a matter of opinion provided for general information purposes only and is not intended as investment advice. Information and analysis above are derived from sources and utilising methods believed to be reliable, but we cannot accept responsibility for any losses you may incur as a result of this analysis. Individuals should consult with their personal financial advisors.
© 2005-2022 http://www.MarketOracle.co.uk - The Market Oracle is a FREE Daily Financial Markets Analysis & Forecasting online publication.