


U.S. Dollar and Manipulation Control the Stock Market
Stock-Markets / US Dollar May 07, 2012 - 03:10 AM GMTBy: Chris_Vermeulen

 Over the weekend I had an interesting conversation with a local trader. We typically meet a few times a year to share our market outlooks, new trading tools and techniques, and usually finish our session off in a debate about the US market manipulation and how to trade around it.
Talking about market manipulation always opens up a can of worms and sparks some interesting theories… And while everyone has their own views and opinion on this subject I thought I would briefly share the main points I pulled from our conversation.
I did talk about the dollar index last week, but the recent price action unfolding today is important so I’m going to recap on it again.
My Weekend Conversation Key Thoughts:
Point form thoughts supporting Lower Equity prices and a Higher Dollar:
- Dollar index looks ready for a major rally (high dollar means lower stocks)
- SP500 may have just formed a double top
- SP500 closed strongly below the 20 day moving average
- First week of May for the past two years have been intermediate market tops
Points supporting Higher Equity prices and a Lower Dollar:
- Countries around the globe are trying to keep their currency value low including the United States.
- Presidential cycle strongly favors higher stocks prices which means the dollar should not rally until Nov.
What do all these points mean? Let’s take a look at the dollar charts below…
4 Hour Dollar Index Chart:
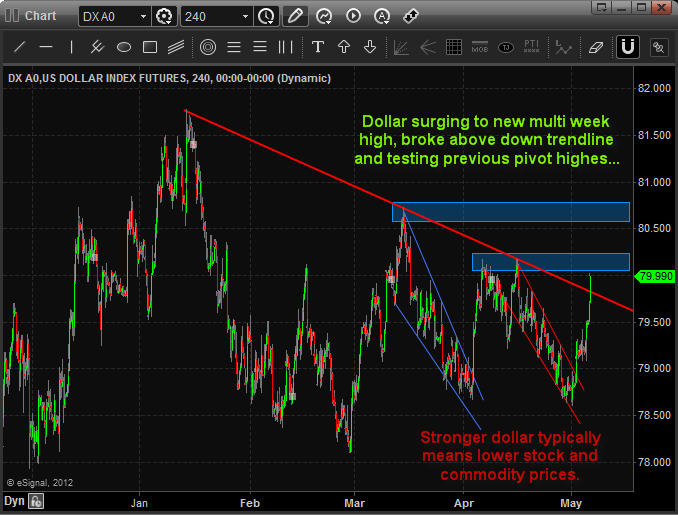
This chart time frame allows us to see all intraday price action while being able to zoom out several months for patterns along with key support and resistance levels.
As you can see over the past few months the dollar has been consolidating sideways. Within this consolidation it has formed two bullish falling wedges with the most recent one breakout last week right on queue.
Using this 24 hour futures dollar index chart we can see where things are trading through the weekend. On Friday the dollar index closed around the 79.50 level. As you can see the dollar has surged Sunday night by more than half a penny breaking through its down trend line.
The next few weeks will continue to be exciting ones as strong moves in the dollar will create wild movements in stocks and commodities.
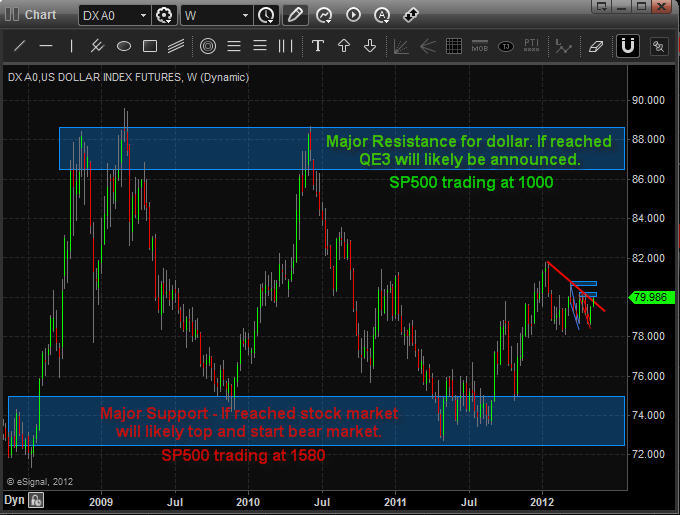
Long Term Weekly Dollar Index Chart:
If you zoom WAY OUT using the weekly chart this shows you the two major areas where the dollar index is likely to reach come November. Also with these levels are my SP500 price points which are simply numbers I pulled from the charts using basic analysis. I say this because I’m not into long term forecasting but rather shorter term price movements. A lot can change between now and then.
So, if the dollar index rallies to the 86 – 88 level then I would expect the SP500 to be trading back down at the 1000 level. If this takes place, the Fed will likely issue QE3 to jam the dollar back down and boost equities.
The flip side of the coin is that the dollar rolls over here and gets pulled down. This will boost stock prices in favor for the president’s election. After that the dollar would likely rally which in turn would put a major top in the stock market, kick starting a bear market.
The big question…
Do you short the market in anticipation of rising dollar and falling stock prices? OR do you buck the trend and stick with the theory of a lower dollar value and presidential cycle?
The charts above clearly show how we are entering a major tipping point for the market and the next couple months are likely going to provide some big price swings for stocks, commodities and currencies.
If you would like to receive my pre-market morning videos, intraday updates and trade alerts visit my newsletter at: http://www.thegoldandoilguy.com/trade-money-emotions.php
By Chris Vermeulen
Chris@TheGoldAndOilGuy.com
Please visit my website for more information. http://www.TheGoldAndOilGuy.com
Chris Vermeulen is Founder of the popular trading site TheGoldAndOilGuy.com. There he shares his highly successful, low-risk trading method. For 6 years Chris has been a leader in teaching others to skillfully trade in gold, oil, and silver in both bull and bear markets. Subscribers to his service depend on Chris' uniquely consistent investment opportunities that carry exceptionally low risk and high return.
This article is intended solely for information purposes. The opinions are those of the author only. Please conduct further research and consult your financial advisor before making any investment/trading decision. No responsibility can be accepted for losses that may result as a consequence of trading on the basis of this analysis.
© 2005-2022 http://www.MarketOracle.co.uk - The Market Oracle is a FREE Daily Financial Markets Analysis & Forecasting online publication.