


Stock Market MAP Waves Part 1 - An Alternative to Elliot Waves
InvestorEducation / Technical Analysis Apr 26, 2012 - 06:23 AM GMTBy: Marc_Horn

 I had real problems with the complexity of Elliot Wave (EW) corrections, where there are never ending corrections, with some EW analysts having multi decade corrections, where higher tops are valid under EW theory. This presents serious investment difficulties, because you never know where you are in any wave. Here I will present MAP waves, my modified wave counting based on analysis with examples and statistics so that probabilities can be established for risk management on a weekly and daily pivot scale. I only look at indices, because individual stocks can be too easily manipulated, including by governments as is done in the US.
The principles of MAP Waves are based on EW. However it is pretty evident when looking at the facts that the 5 wave theory offers a much better investment tool than EW. MAP waves using the following simple 5 wave rules, pivot 1 must be >= pivot 0 / pivot 2 <= pivot 1 and >= pivot 0 / pivot 3 >= pivot 1 / pivot 4 >= pivot 2 / pivot 5 >=pivot 3, we can assign probabilities on various timescales to make sensible risk reward investment decisions which is not possible under EW.
We will start with charts on monthly bar scale.
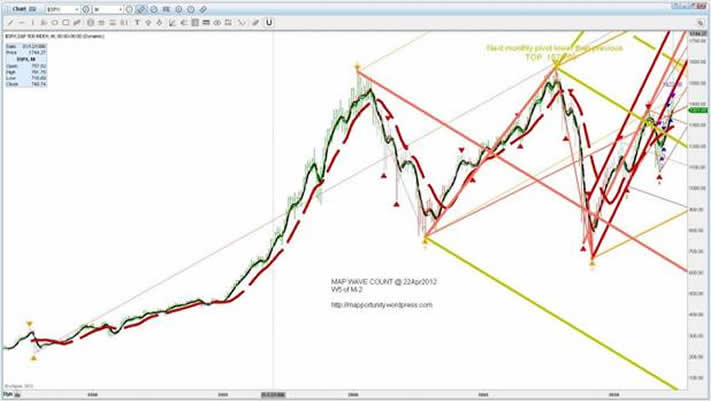
Looking at the red dashed 14SMA we can clearly see 2 tops and 2 bottoms, with the 2007 top being the highest, and most likely it will stand as the peak as the 2009 was lower than the 2002 low. Many EW theorists call the 2000 high the top. However just following the basic EW theory, which is the basis of MAP waves, of 5 waves 2007 is the most likely top.
Using a shorter SMA, the bold black line we can see that the 2000 to 2002 decline has a clear 5 wave structure, where as the 2007 to 2009 decline shows a 3 wave - described by EW as an ABC correction.
The current rise from the 2009 bottom shows a clear 5 wave structure, which, even if the recent high is the final top then it is valid under EW. The rise from 2002 to 2007 however does not show such an obvious wave count, and I suggest that that is the result of sub waves, or extensions to those familiar with EW, which all show a valid EW 5 wave count.
Below I have added daily pivots, so that you can see the sub waves.
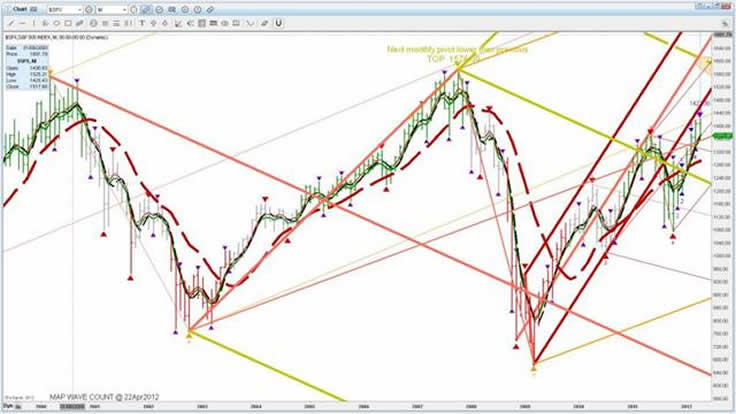
So following the basic principles of MAP waves in the S&P we have the following showing a clear 5 wave pattern;
Weekly pivots - 3 of 4
Daily pivots - 10 of 10.
If we change to a weekly scale it is obvious that the 2007 to 2009 drop also has a clear 5 wave structure as shown below.
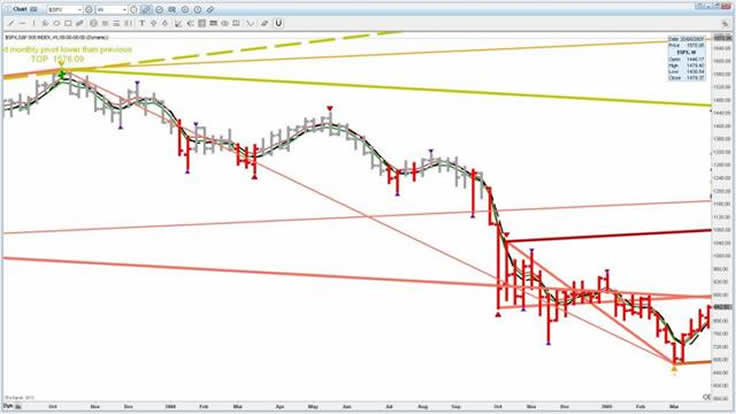
So on a weekly and daily pivot scale on the S&P the 5 wave structure has a 100% record however from a small sample of only 14!
Applying the same methodology to the Russel it would appear that the 2011 top is pivot 5 off the 1987 bottom, but is not clear yet from the long SMA.
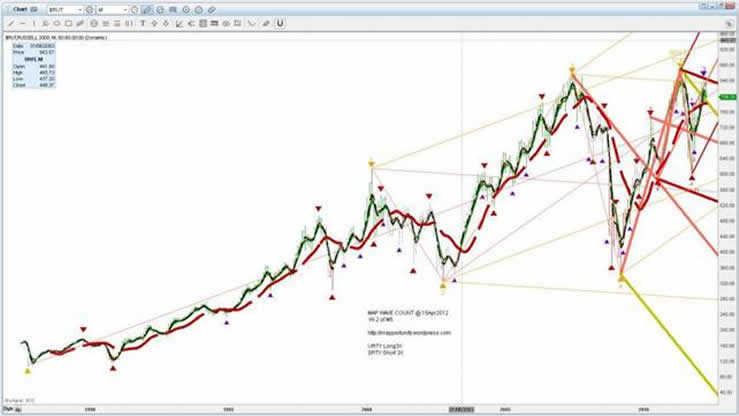
Ignoring that as we will not know for a while yet, and anyway I don't believe there are many investors that are looking at 25 year returns, the weekly 5 pivot count is 5 of 5 and without changing scale 11 of 11 daily 5 wave counts are clearly visible. (I have only shown bottom of pairs but check for yourself! So 100% and sample size is now 30 5 wave counts.
Applying the same methodology to the DJIA it would appear that the 2007 top is pivot 5 off the 1987 bottom, but is not clear yet from the long SMA.
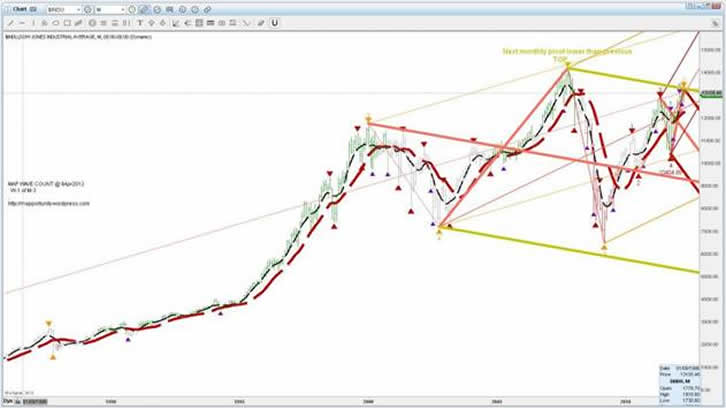
The weekly 5 pivot count is 5 of 5 and without changing scale 7 of 7 daily 5 wave counts are clearly visible. (I have only shown bottom of pairs but check for yourself! So 100% and sample size is now 42 5 wave counts.
The other main US index, the Nasdaq however on the monthly scale poses an interesting decision. How to count the bubble top of 2000? I offer 2 options for the monthly wave counts as shown below, but because of the investment scale it is largely irrelevant!
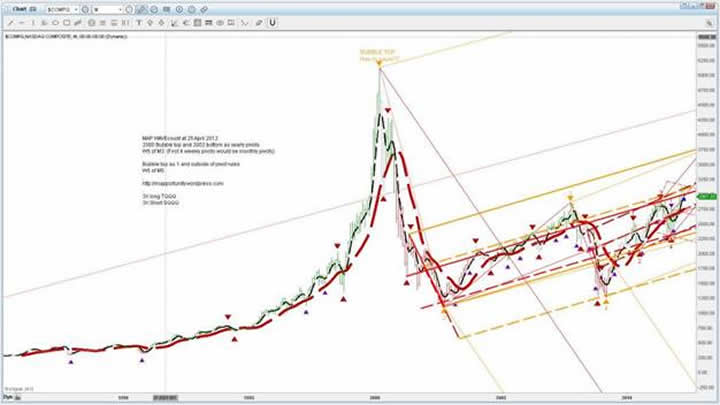
Irrespective of the above mentioned conundrum, where monthly pivots have not been included into the previous counts anyway, we have 5 of 5 weekly 5 waves, and 9 of 9 daily 5 waves that are clear on this scale, making our totals 56 5 wave counts - 100%.
So to see if this works on other indices below is the DAX.
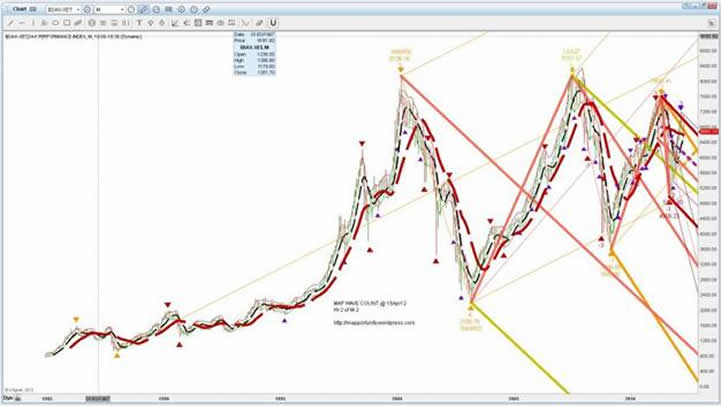
The DAX shows the same 5 wave pattern adding 5 of 5 to the weekly pivot scale and 11 of 11 to the daily pivot scale, maintaining the 100% bringing the sample size upto 72!
I have not previously looked at the FTSE but would assume a similar pattern will emerge and is shown below.
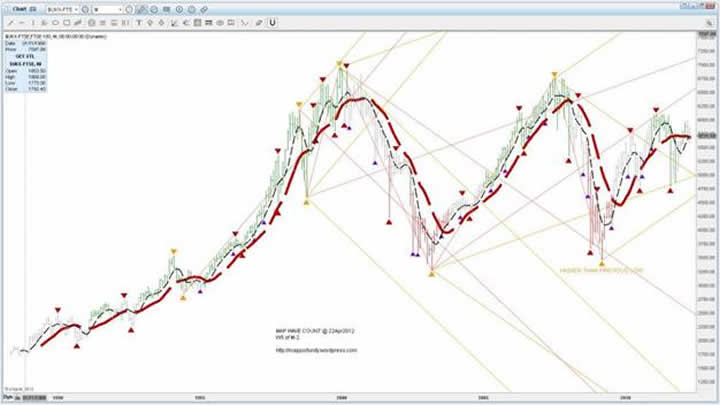
Again the waves are clear, however on the monthly pivot scale which have not been counted for the probabilities, we have a break of the rules or indicating that the 2003 low may be a larger scale correction than a monthly pivot! We will not know for a long time and either need a new high above the 2007 high or a new low below the 2003 low to confirm. Either way it does not really matter as the investment term using those scale pivots is not sensible! A second alternative is that there is a sub wave where the 2009 low is pivot -1 and we are completing pivot -2. However looking at the other indices presented I would favour that this is a break of the rules!
So on the FTSE we have 6 of 6 weekly waves and 10 of 10 daily waves visible on this scale, maintaining the 100% record with a sample size of 88.
All in all I think MAP waves offer a far better insight as to what is happening in the markets than EW. Not only that, but has predictive probability that EW does not allowing more informed investment decisions to be made and on a weekly and daily pivot scale. Even if it is 1 error if we include the monthly FTSE anomaly it is over 90% accurate, all be it with a small sample. I am sure this is statistically significant.
I am sure had Ralph Nelson Elliot had the power of computing that I have he would have come to this same conclusion when he developed his theory all those years ago!
Please note that the longer SMA has already turned negative for the DAX and FTSE which would add weight to my previous analysis http://www.marketoracle.co.uk/Article33868.html that European socialist decay is ahead of America’s.
On the Weekly and Daily pivot scales it is clear that a 5 wave count up and down has a high risk to reward ratio! The problem however is identifying the pivots in advance as even on a daily scale it is way behind the curve by the time you have reasonable confirmation using wave counting in isolation. In the next in this MAP wave counting series I will be looking at 4 hour, hour and 15 minute pivot scales which will highlight the dangers of using any wave counting theories in isolation when making investment decisions, as there is ALLWAYS a bullish and bearish scenario!
For more information of how I do what I do http://mapportunity.wordpress.com/ . Comments and discussions very welcome!
The statements, opinions and analyses presented in this site are provided as educational and general information only. Opinions, estimates, buy and sell signals, and probabilities expressed herein constitute the judgment of the author as of the date indicated and are subject to change without notice.
Nothing contained in this site is intended to be, nor shall it be construed as, investment advice, nor is it to be relied upon in making any investment or other decision.
Prior to making any investment decision, you are advised to consult with your broker, investment advisor or other appropriate tax or financial professional to determine the suitability of any investment.
© 2012 Copyright Marc Horn - All Rights Reserved Disclaimer: The above is a matter of opinion provided for general information purposes only and is not intended as investment advice. Information and analysis above are derived from sources and utilising methods believed to be reliable, but we cannot accept responsibility for any losses you may incur as a result of this analysis. Individuals should consult with their personal financial advisors.
© 2005-2022 http://www.MarketOracle.co.uk - The Market Oracle is a FREE Daily Financial Markets Analysis & Forecasting online publication.