


Global Stock Markets Down Trend Continues
Stock-Markets / Stock Markets 2012 Apr 15, 2012 - 06:29 AM GMTBy: Tony_Caldaro

Traders followed through with the last friday’s abbreviated holiday selloff, as the market gapped down 13 points from last thursday’s close on monday. Near the close on tuesday the market was down 42 points on the week. But a mid-week rally helped. For the week the SPX/DOW were -1.8%, and the NDX/NAZ were -2.3%. This was the largest weekly decline since mid-December. Asian markets dipped 0.2%, but European markets dropped 3.5%. On the economic front, reports ended the week balanced. On the uptick: wholesale inventories, export/import prices, the WLEI, and the trade deficit improved. On the downtick: the CPI/PPI, consumer sentiment, and both the budget deficit and weekly jobless claims rose. Next week we get a look at retail sales, housing, industrial production and the leading indicators.
LONG TERM: bull market
Our long term position remains the same as it has for the past few years. A Supercycle wave 2 low occurred in March 2009 at SPX 667. Since then the stock market has been rising in a Cycle wave [1] bull market. Primary I, of this five primary wave bull market, ended in May 2011 at SPX 1371, and Primary II ended in October 2011 at SPX 1075. Primary wave III is currently underway. Within Primary III Major wave 1 completed at SPX 1293 in October and Major 2 at SPX 1159 in November. Major wave 3 appears to have completed at the April SPX 1422 high. Major wave 4 should be underway now.
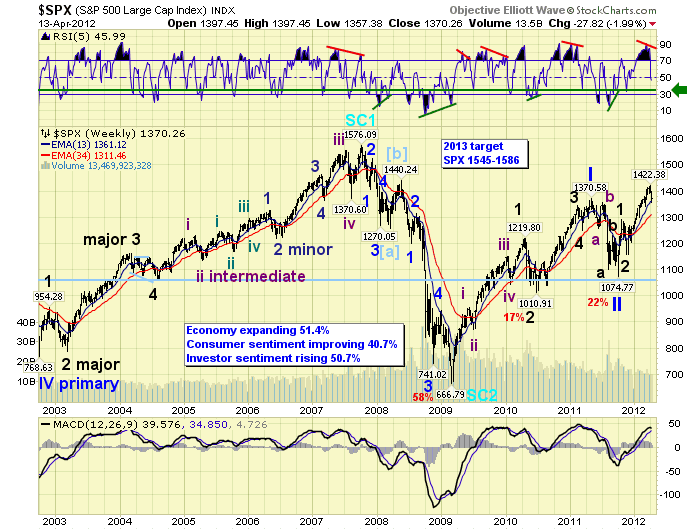
The weekly chart displays the labeling from October 2002. Notice the 2002-2007 bull market was five waves. Then the 2007-2009 bear market was three waves. No other counts fit these wave patterns. Now notice how the RSI gets overbought during uptrends within bull markets, and oversold during downtrends. During the 2002-2007 bull market nearly every downtrend hit the oversold level at 30. This bull market is not doing that. Most of the downtrends have ended at around 35 at the green line. We believe this correction could end there too.
MEDIUM TERM: DOW confirmed downtrend, SPX likely to follow
The DOW has confirmed what is most likely a Major wave 3 top and Major wave 4 downtrend underway. The SPX/NDX/NAZ have yet to confirm a downtrend. For the time being this creates some alternate possibilities which were mentioned in the thursday update. Our preferred count suggests the five month uptrend, November – April, unfolded in five Intermediate waves: wave i SPX 1267, wave ii SPX 1202, wave iii SPX 1378, wave iv SPX 1340, and wave v SPX 1422. And, a downtrend is currently underway. Normal support after a bull market uptrend is usually the previous fourth wave. However, since the fifth wave was shorter than waves one and three, this level is not likely to hold. We place support within the SPX 1300 to 1340 range, with SPX 1313 to 1327 the likely target. We provided the rationale for these levels in last weekend’s update.
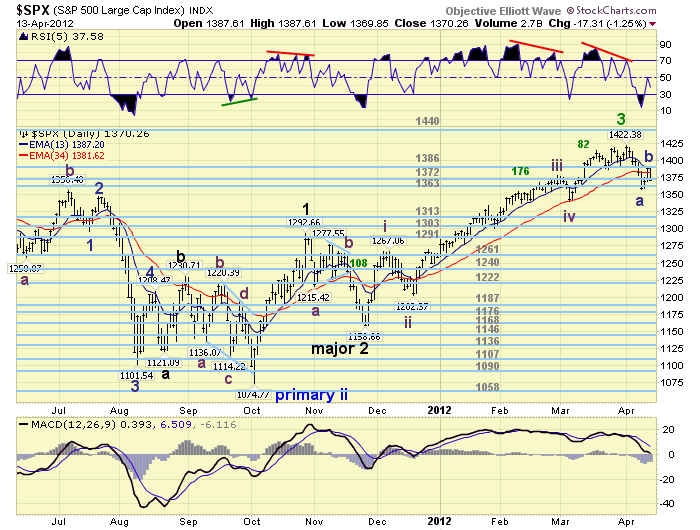
The typical downtrend, during this bull market, has lasted about one month. This suggests a May low. The alternation between second waves and fourth waves, in this bull market, has been complex first and simple next. This suggests this correction will be simpler than the Nov11-Dec11 Major wave 2 correction. With these two factors in mind we are expecting an ABC decline consisting of three Intermediate waves. Within each downtrending Intermediate wave we are expecting an ABC decline consisting of three Minor waves. This pattern should be sufficient to cover the distance expected in the time allotted. The first decline, SPX 1422-1357, we labeled Minor wave a of Int. A. The recent rally, SPX 1357-1388, we labeled Minor b of Int. A. The current decline, from SPX 1386, should be Minor c of Int. A. After it bottoms we should get another counter-trend rally. Then the next Minor abc decline to end the correction.
SHORT TERM
As Intermediate wave v of the uptrend was rallying into its SPX 1422 high we noticed an ending diagonal triangle forming. We first wrote about this pattern more than three weeks ago. The rising wedge was quite symmetrical: 1414, 1387, 1419, 1392 and 1422. When uptrends end in diagonal triangles there is usally a sharp selloff back to, or below, the level the diagonal started. Which in this case in SPX 1340.
The first decline, SPX 1422 – 1357, was essentially straight down with only three intervening 8 to 9 point rallies. We labled this Minor wave a. When the market hit extremely oversold on tuesday we expected a bounce. Over the next two days the market rallied from SPX 1357 to 1388. Essentially from the OEW 1363 pivot range to the 1386 pivot range. This was a normal retracement, it created quite an overbought condition, and it took the form of an abc. We labeled this Minor wave b. After the SPX 1388 close on thursday, the market opened lower and declined steadily on friday ending at its 1370 low. This should be Minor wave c underway.
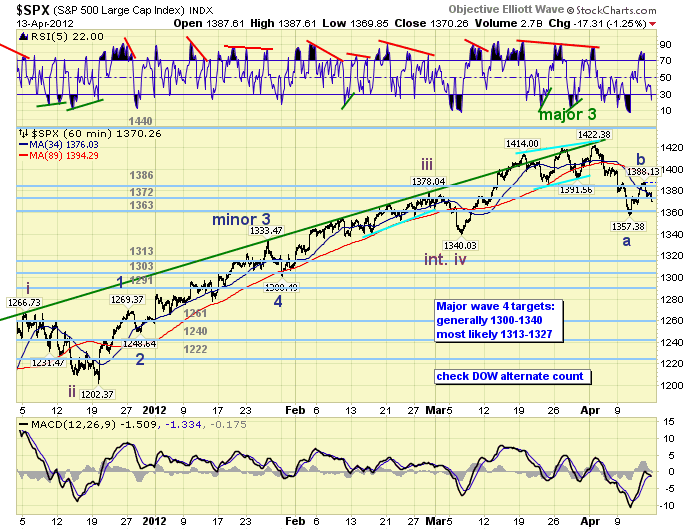
It is possible the SPX could test 1340 during this decline, which is the previous Int. wave iv support. This could end Int. wave A. Then it could rally back into the 1363-1372-1386 pivot zone for Int. wave B. Before starting its next abc decline into the final low for the correction, ending Int. wave c. The Major wave 2 correction was also quite volatile. Short term support is at the 1363 pivot range and SPX 1340, with resistance at the 1372 and 1386 pivots. Short term momentum ended the week quite oversold. The market could bounce around a bit, to work off this oversold condition, before it heads lower. Best to your trading!
FOREIGN MARKETS
The Asian markets were quite mixed declining only 0.2% on the week. China, Hong Kong, India and Japan are in confirmed downtrends.
The European markets tumbled for the fourth week in a row losing 3.5%. All but Switzerland are in confirmed downtrends.
The Commodity equity group were all lower losing 1.5%. All three Brazil, Canada and Russia are in confirmed downtrends.
The DJ World index is also downtrending and lost 1.5% on the week. Fifteen of the twenty world indices we track are in confirmed downtrends.
COMMODITIES
Bonds appear to be uptrending, gaining 1.2% on the week. The 10 YR yield has dropped under 2.0% again.
Crude continues its downtrend losing 0.2% on the week. There are some signs of bottoming, however, as Crude is displaying its first positive divergence since the Sept11 low at $76.25.
Gold remains in a downtrend, but gained 1.8% on the week. It also appears to be in the bottoming process after a now two month downtrend.
The USD is still uptrending, but lost 0.2% on the week. The downtrending EUR gained 0.1%, and the now uptrending JPYUSD gained 1.7%.
NEXT WEEK
Monday kicks off the economic week with Retail sales and the NY FED at 8:30. Then at 10:00 Business inventories and the NAHB sentiment reading. On tuesday, Housing starts and Building permits at 8:30, and then Industrial production at 9:15. Thursday we have weekly Jobless claims, Existing home sales, the Philly FED, and the Leading indicators. Friday is Options expiration. The FED has nothing on the agenda ahead of next week’s FOMC meeting. The ECB, however, meets on wednesday in Frankfurt. This could be an important meeting considering the turmoil in the European stock markets. Best to your week!
CHARTS: http://stockcharts.com/...
http://caldaroew.spaces.live.com
After about 40 years of investing in the markets one learns that the markets are constantly changing, not only in price, but in what drives the markets. In the 1960s, the Nifty Fifty were the leaders of the stock market. In the 1970s, stock selection using Technical Analysis was important, as the market stayed with a trading range for the entire decade. In the 1980s, the market finally broke out of it doldrums, as the DOW broke through 1100 in 1982, and launched the greatest bull market on record.
Sharing is an important aspect of a life. Over 100 people have joined our group, from all walks of life, covering twenty three countries across the globe. It's been the most fun I have ever had in the market. Sharing uncommon knowledge, with investors. In hope of aiding them in finding their financial independence.
Copyright © 2012 Tony Caldaro - All Rights Reserved Disclaimer: The above is a matter of opinion provided for general information purposes only and is not intended as investment advice. Information and analysis above are derived from sources and utilising methods believed to be reliable, but we cannot accept responsibility for any losses you may incur as a result of this analysis. Individuals should consult with their personal financial advisors.
© 2005-2022 http://www.MarketOracle.co.uk - The Market Oracle is a FREE Daily Financial Markets Analysis & Forecasting online publication.