


Discouraged U.S. Workers NOT THE REASON for decline in March Unemployment Rate
Economics / Unemployment Apr 07, 2012 - 12:57 PM GMTBy: Paul_L_Kasriel

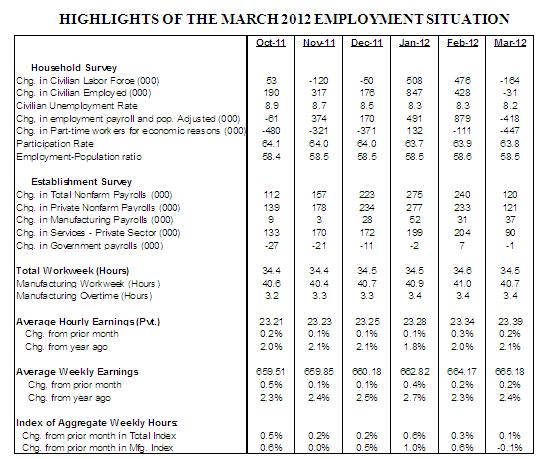
 Civilian Unemployment Rate: 8.2% in March, down one notch from February. Cycle high jobless rate for the recent recession is 10.0%, registered in October 2009.
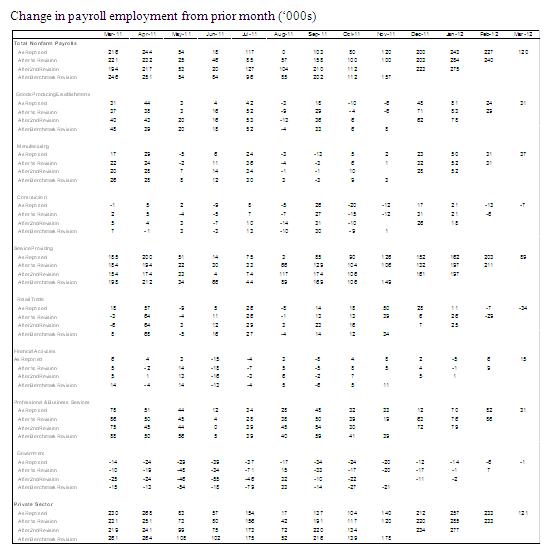
Payroll Employment: +120,000 jobs in March vs. +240,000 in February. Private sector jobs increased 121,000 after a gain of 233,000 in February. A net gain of 4,000 jobs due to revisions of payroll estimates of January and February.
Private Sector Hourly Earnings: $23.39 in March vs. $23.34 in February; 2.1% y-o-y increase in March vs. 2.0% gain in February.
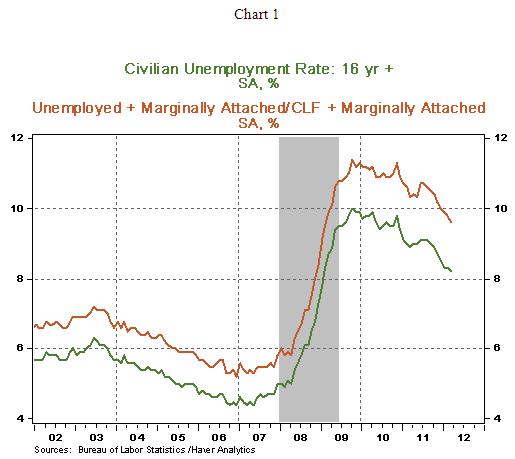
Household Survey – The unemployment rate edged down to 8.2% in March from 8.3% in February. The jobless rate at 8.3% in the first quarter of 2012 shows a noticeable decline from a year ago when it stood at 9.0%. A broad measure of unemployment (U5) including those marginally attached to the labor force (people who wanted and were available for work and had looked for employment in the past year but not in the four weeks prior to the survey) fell to 9.6% in March from 9.8% in the prior month.
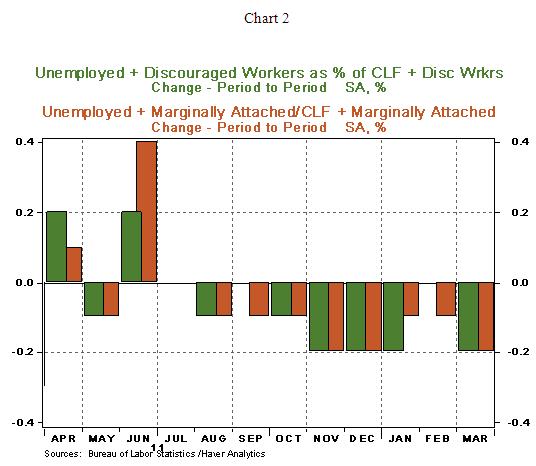
Broad measures of unemployment U4 (discouraged workers) and U5 (marginally attached, which includes discouraged workers) reflect declines in discouraged (-29,000) and marginally attached (-16,000) workers. The conventional-wisdom argument that the primary reason the official unemployment rate fell in March is that people dropped out of the labor force because of a lack of employment opportunities. However, the data in Chart 2 showing that the number of marginally-attached workers declined in March does not support the conventional-wisdom argument for the decline in the official March unemployment rate. If the primary reason for the decline in the March official unemployment rate was related to an increase in marginally-attached workers, why would the unemployment rate have declined when these marginally-attached workers were added back in to the unemployed as well as the labor force? In other words, the decline in the March official unemployment rate could not have resulted from an increase in marginally-attached workers inasmuch as there was an outright decline in these workers.
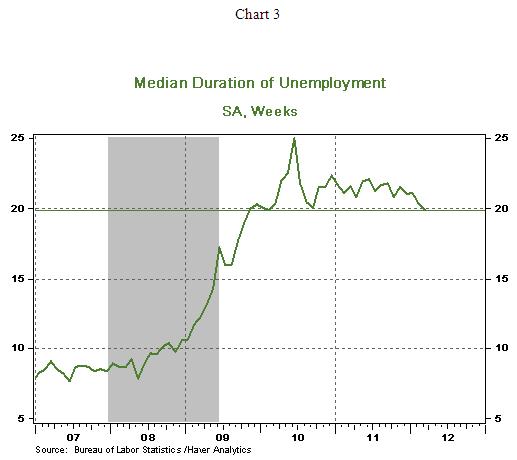
Also, the median duration of unemployment fell to 19.9 weeks in March, down from 21.1 weeks in January and it is the lowest since October of 2009 (see Chart 3).
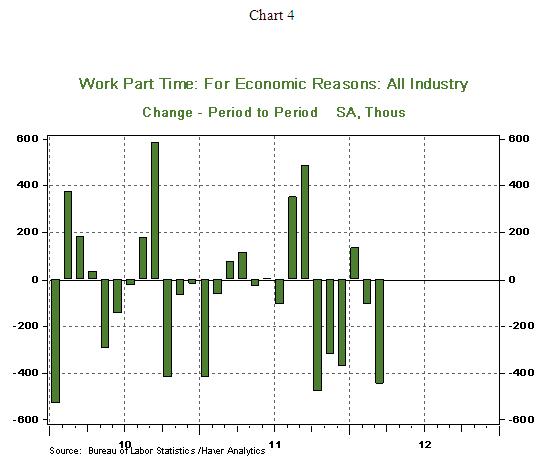
Part-time employment (-447,000) because that it what was available registered a sharp drop in March, marking the fifth monthly decline in the six five months. Charts 2-4 point to small but noteworthy positive developments in the labor market.
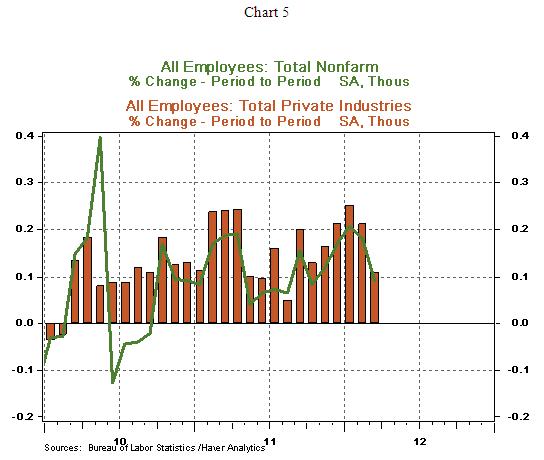
Establishment Survey – Total payrolls increased 120,000 in March, following an upwardly revised gain of 240,000 jobs in February. Private sector employment advanced 121,000 in March after posting an increase of 233,000 in the previous month.
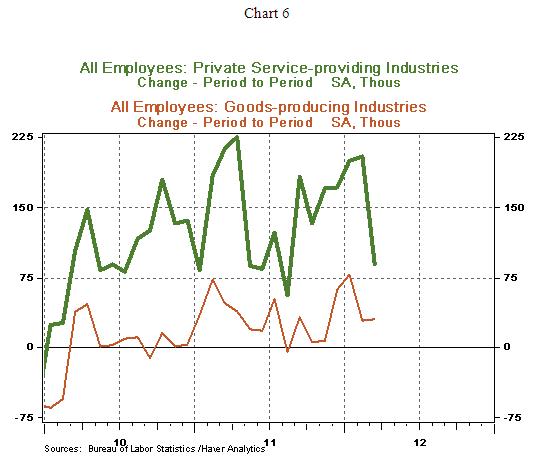
The sharp dip in the pace of hiring in March was concentrated in the service sector. Service sector (private) hiring rose only 90,000 in March compared with an increase of 204,000 in February. Retail employment fell in March, while professional and business services and financial sector hiring posted smaller gains in payrolls during March compared with February. Payroll employment in the goods sector (factory, mining, and construction) advanced 31,000 in March vs. an increase of 29,000 in February (see Chart 6). Government employment fell 1,000 in March vs. an increase of 7,000 in February.
Highlights of changes in payrolls during March 2012:
Construction: -7,000 vs. -6,000 in February
Manufacturing: +37,000 vs. +31,000 in January
Private sector service employment: +90,000 vs. +233,000 in February
Retail employment: -34,000 vs. -29,000 in February
Professional and business services: +31,000 vs. +86,000 in February
Temporary help: -7,500 vs. +54,900 in February
Financial activities: +15,000 vs. +9,000 in February
Health care: +26,000 vs. +42,000 in February
Government: -1,000 vs. +7,000 in February
The 0.1% dip of the factory man-hours index suggests that industrial production probably slipped slightly in March. The 0.2% increase in weekly earnings points to only a small increase in the wage and salary component of personal income in March. Hourly earnings rose 2.1% in March vs. a 2.0% gain in the prior month.
Conclusion – The vast majority interpreted the minutes of the March FOMC meeting, published on April 3, as the Fed unwilling to engage in the next round of quantitative easing. We read it as a balanced view about the economy with both bullish and bearish economic developments noted to imply that the Fed is on a watch-and-wait mode. The Fed is most likely to retain this posture at the conclusion of the April 24-25 FOMC meeting also.
Post-April 30 email: Econtrarian@gmail.com
Paul Kasriel is the recipient of the 2006 Lawrence R. Klein Award for Blue Chip Forecasting Accuracy
by Paul Kasriel and Asha Bangalore
The Northern Trust Company
Economic Research Department - Daily Global Commentary
Copyright © 2011 Paul Kasriel
Paul joined the economic research unit of The Northern Trust Company in 1986 as Vice President and Economist, being named Senior Vice President and Director of Economic Research in 2000. His economic and interest rate forecasts are used both internally and by clients. The accuracy of the Economic Research Department's forecasts has consistently been highly-ranked in the Blue Chip survey of about 50 forecasters over the years. To that point, Paul received the prestigious 2006 Lawrence R. Klein Award for having the most accurate economic forecast among the Blue Chip survey participants for the years 2002 through 2005.
The opinions expressed herein are those of the author and do not necessarily represent the views of The Northern Trust Company. The Northern Trust Company does not warrant the accuracy or completeness of information contained herein, such information is subject to change and is not intended to influence your investment decisions.
Paul L. Kasriel Archive |
© 2005-2022 http://www.MarketOracle.co.uk - The Market Oracle is a FREE Daily Financial Markets Analysis & Forecasting online publication.