


Stock Market New Price Target Almost Reached, Gold Continuing Correction
Stock-Markets / Financial Markets 2012 Mar 19, 2012 - 12:45 AM GMTBy: Andre_Gratian

 Current Position of the Market
SPX: Very Long-term trend - The very-long-term cycles are down and, if they make their lows when expected (after this bull market is over) there will be another steep and prolonged decline into late 2014. It is probable, however, that the steep correction of 2007-2009 will have curtailed the full downward pressure potential of the 120-yr cycle.
SPX: Intermediate trend - The intermediate uptrend is still intact, but a short-term top is forming.
Analysis of the short-term trend is done on a daily basis with the help of hourly charts. It is an important adjunct to the analysis of daily and weekly charts which discusses the course of longer market trends.
Market Overview
There are signs that the rally which started at 1159 is just about ready for a consolidation/correction.
Although there are higher projections, the SPX could pause at 1407-1411 and, if that is exceeded, at 1427.
From a structural standpoint, it looks as if we are completing a five-wave pattern from 1159. On a larger scale, this could be only wave 3 from 1075, and if that is the case, this would only be a short-term top; hopefully, a little more important than the one which formed at 1378. To start an intermediate trend correction, we may have to wait until we get to about 1475. This will be confirmed and refined after we are done with the short-term correction.
Even if we make a high in the 1407-1411 area, we may spend a little time building a topping formation. As of now, very little distribution is showing on the P&F chart and, on Friday, the VIX made a new low and the XLF made a recovery high. Neither one of these two indices appears ready to signal an important market top. The VIX P&F chart does suggest a potential low at about 13, and Friday's 13.66 may have been good enough to end its decline but, even if the bottom has been reached, no base has been formed which could suggest that the VIX is ready for an important up-move. I'll discuss those two indices in more detail a little later on.
As we analyze the charts, we'll also see that their indicators are not quite ready to signal an immediate and significant decline. The reason is that professionals are aware that the bull market which started in 2009 is not over and that there are higher prices ahead - perhaps much higher! There should not be heavy selling at this level.
Chart analysis
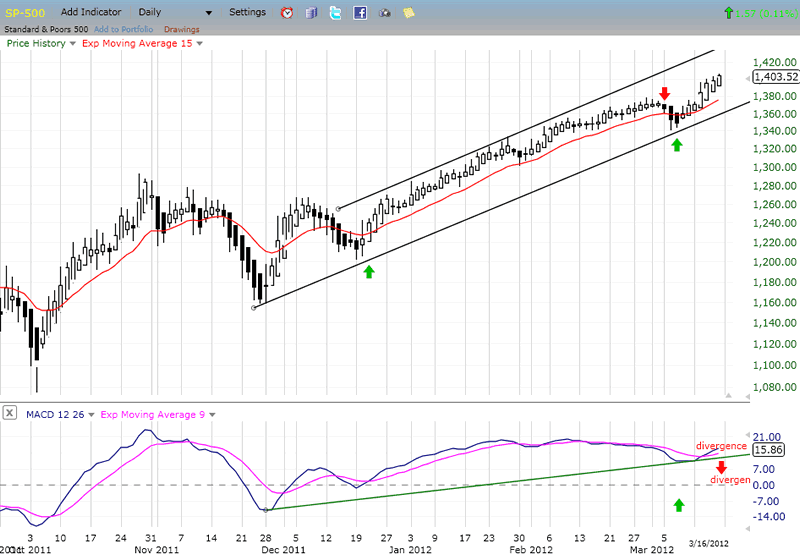
This SPX Daily Chart is plotted in Heiken Ashi, a simplified form of candlestick. It does not yet show a topping pattern but, after viewing the hourly chart, we'll see that a short-term top could be near. On this chart, the only thing that is beginning to show weakness in the trend is the MACD which has developed slight negative divergence.
Starting from the 1159 low in November, the price pattern has been contained in a bullish channel and appears to consists of 5 major waves. We are currently trading in the 5th wave of that pattern and, since it is nearing the P&F phase projection of 1407-1427 (taken across the 1220 base), we should be looking for the market to pause and most likely trade outside of its channel before the correction is complete.
Note also that (so far) the index only dipped briefly below its 15-dma without turning it down. It will have to cross below it more decisively before we can be assured of a top.
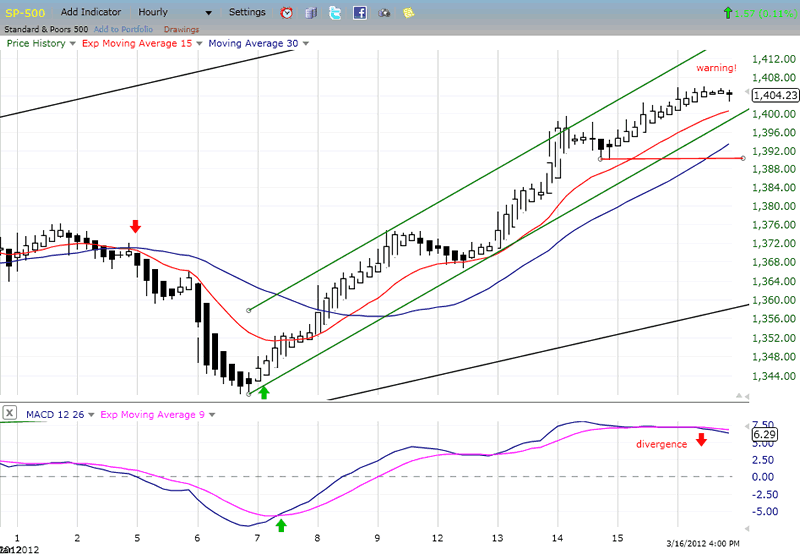
The Hourly Chart is also plotted in Heiken Ashi and this time, on the shorter time frame, the warning of a potential reversal has been issued. It is confirmed by the MACD which has already crossed after a stretch of negative divergence. But the MACD is so high above the zero line, that it is not suggesting important weakness right away.
What is perceived to be the "5th wave" - which may or may not be complete -- is also rising in a nice channel. Breaking below 1390 would be the first confirmation of a reversal, and below 1366 would signal that an end to the move from 1159 is likely. Until we do break below 1390, we'll hold off calling for the end of the 5th wave, because it could evolve into a more complex pattern.
Cycles
There is a minor cycle due on Monday, but we are still looking for a top in the 13-14 week high-to-high cycle which has now reached its ideal time frame.
It is likely that the 22-week cycle caused the quick drop to 1340 and is pushing prices higher.
It's also evident that the market is still benefiting from the upward phase of the 3-yr cycle which bottomed in October.
The top of the 36-wk cycle is due in the next couple of weeks and could keep prices from declining until then.
Breadth
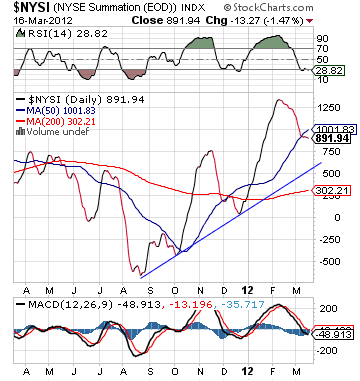
The NYSE Summation Index (courtesy of StockCharts.com) has now broken the 50-dma and flattened out. Its RSI is oversold and the histogram has turned up. All this suggests that an important decline may not be imminent.
Sentiment
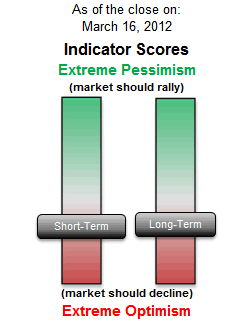
The SentimenTrader (courtesy of same) long-term indicator has rallied a little and neither it nor the short-term indicator are at levels which are excessively bearish -- another sign that we should not expect a significant decline at this time.
VIX
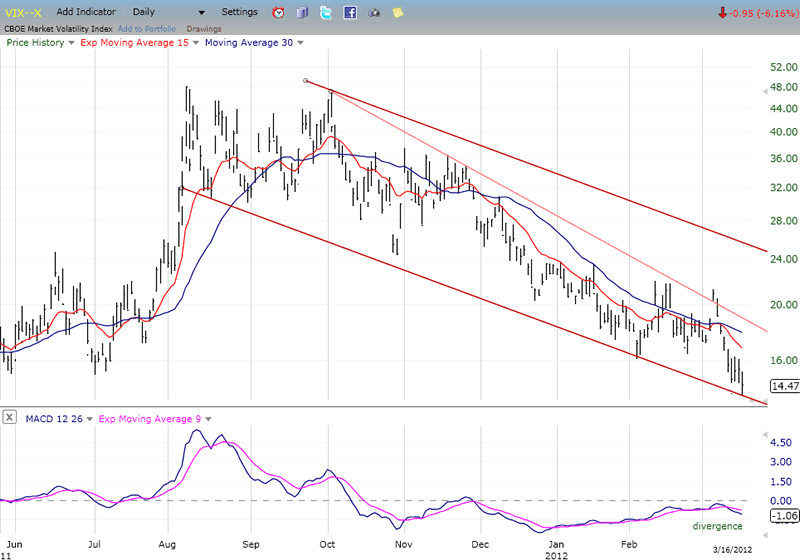
In February, the VIX started to make a nice basing pattern above 16 which turned out to be only a re-distribution area which led to lower prices. On Friday, the VIX got down to 13.66 (a new low) before it rallied a little.
Of all the indicators, this is perhaps the most important one telling us that we should not be looking for a significant top in the equity indices at this time. Its normal pattern is to make a base, followed by a successful re-test of its low as the equity indices make new highs. This pattern is particularly important - as I have shown previously -- when it occurs on the weekly chart. We have not arrived at that stage suggesting that not only are we not at a very important top, but that it is likely that there will be higher prices ahead.
Over the short-term, the re-distribution level which formed on the Point & Figure chart gave a projection of about 13. It's possible that the VIX has now made its low, and has already started to form a small base at the 14 level. In the near future, additional basing would prepare it to finally rise from the bottom of the declining channel which it has been hugging all along.
XLF (Financial SPDR)
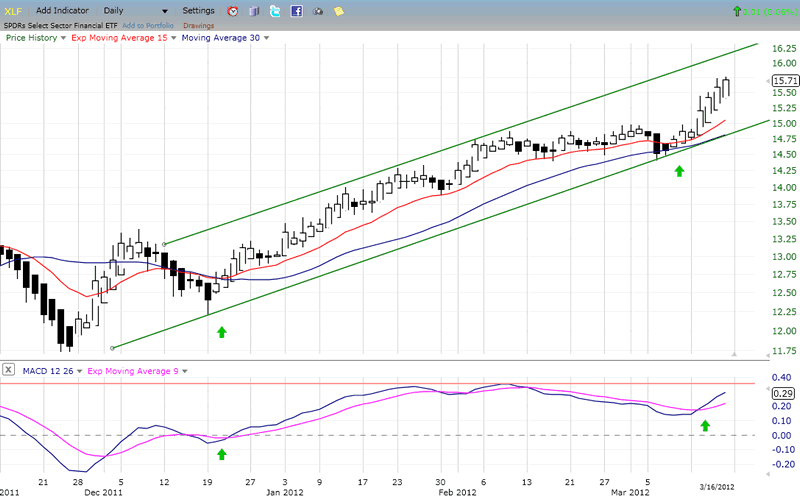
The XLF is another index which has a great influence on the SPX because the SPX contains so many financial stocks. It is difficult for the SPX to come down while the XLF is still strong. Like the SPX, it is still in an uptrend which does not seem particularly vulnerable to an important reversal at this time with an MACD which is only showing minor negative divergence and is still rising.
BONDS
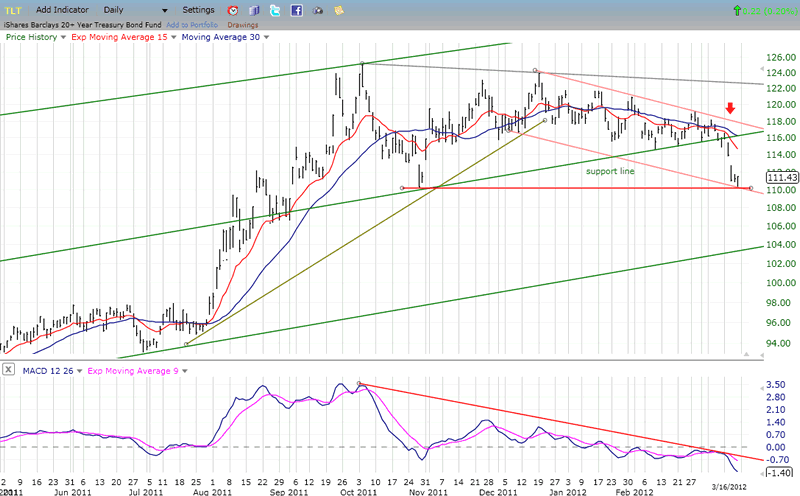
TLT, like all bonds, is beginning to break down. After crawling along its support line for a few weeks, it has suddenly let go and dropped below it. This is a sign that it may be on the way to challenging the bottom of its long-term up channel. For the time being, it's holding at a previous short-term low which coincides with its 200-dma and the bottom trend line of a short-term declining channel.
While this level could hold it for a little while longer, the top formation that it has made looks bearish on the Point & Figure chart. Just the distribution phase that has taken place from its last top has a projection down to about 101. But if the count is taken all the way across the 116 level, that gives it a target of 88. Extending the count further all the way to the top could bring it down another dozen points. That, of course is a long-term count and it may be months before it is reached.
What it does suggest is that, in spite of the Fed's insistence that it is going to keep rates low until 1214, bonds are beginning to smell a whiff of inflation which, although it is unlikely to get out of control for quite a while, nevertheless suggests that the era of super-low interest rates may be over. That, of course, will depend on future Fed policy.
UUP (Dollar ETF) Daily Chart.
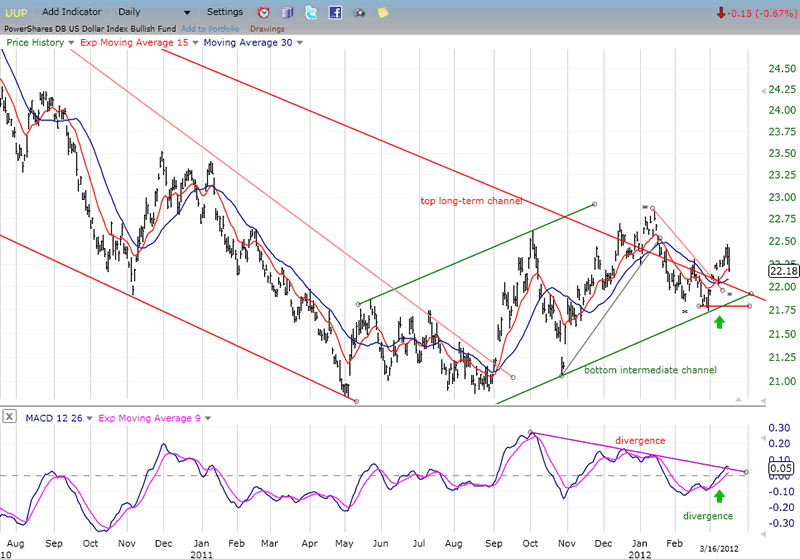
The UUP is an index that should benefit from the correcting bond market, and the chart is beginning to show it. It has now broken out of its long-term channel for the second time and should move higher. Remember that the base that was formed between May and August of last year has given us a target of 25 - which is equivalent to 90 on the dollar.
The small asterisk below Friday's low, marks the bottoming phase of a 25-day cycle which has done a pretty good job of guiding the short-term trend. If it is a low, UUP should continue its uptrend as early as next week. The alternative would be that the cycle inverted and made a high on Thursday, which would mean a longer consolidation period for the index. We'll find out which it is from the direction in which prices move in the next few days.
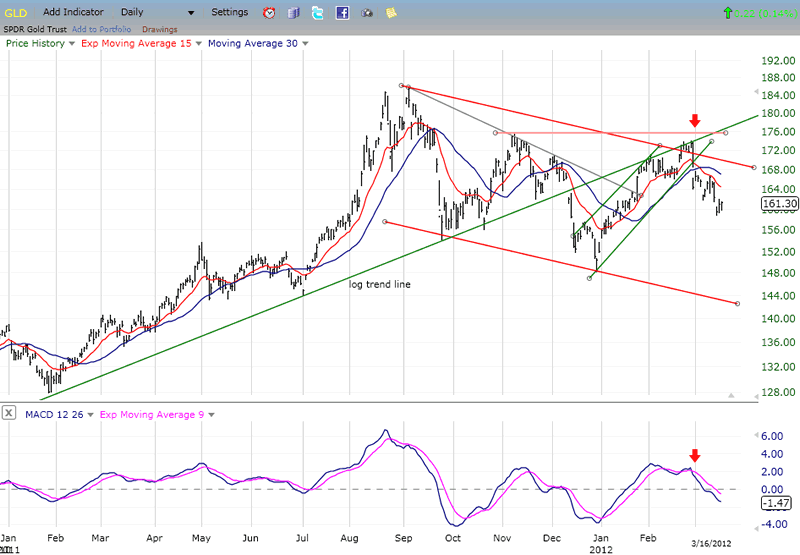
GLD (ETF for gold)
Bonds coming down, and the dollar moving up would be a good reason for GLD to continue its intermediate correction, and that appears to be what is happening.
On a log scale chart, a trend line drawn from the 2008 bottom was broken in December 2011. That marked the beginning of the first important correction in three years. By the end of the month, the index started a rally which back-tested the broken trend line. Twice, it tried to penetrate it and failed both times. Since then, it has pulled back and has found a modicum of support on its 200-dma which, in conjunction with a filled short-term count to 159, could hold it for a while. If it is broken, then more important projections could come into play, sending the index to 154 and perhaps to 149. That could create a double-bottom from which GLD could resume its long-term uptrend.
The MACD has broken below its zero line and it may take a while before it can level out and position itself for a short-term uptrend. The 15-dma has crossed the 30-dma and both are moving lower.
If GLD continues to correct as long as it takes the dollar (presently at about 80) to move all the way to its 90 projection, it will be correcting for some time. There will be a better chance of this if the index moves below its 200-dma (not shown on the chart below). In spite of the correction, the longer average has continued to move up, although beginning to flatten. Should GLD break it again, it could put the 200-dma in a downtrend and prolong the correction.
Summary
The SPX is reaching an interim projection to 1407-1411 which could be extended to 1427. This could stop the advance for a while. But since very little distribution is showing on the P&F chart, the index may undergo a short top-building phase before a noteworthy decline materializes.
The fact that the VIX made a new low last Friday substantiates this kind of scenario.
FREE TRIAL SUBSCRIPTON
If precision in market timing for all time frames is something which is important to you, you should consider a trial subscription to my service. It is free, and you will have four weeks to evaluate its worth.
For a FREE 4-week trial. Send an email to: ajg@cybertrails.com
For further subscription options, payment plans, and for important general information, I encourage you to visit my website at www.marketurningpoints.com. It contains summaries of my background, my investment and trading strategies and my unique method of intra-day communication with Market Turning Points subscribers.
By Andre Gratian
MarketTurningPoints.com
A market advisory service should be evaluated on the basis of its forecasting accuracy and cost. At $25.00 per month, this service is probably the best all-around value. Two areas of analysis that are unmatched anywhere else -- cycles (from 2.5-wk to 18-years and longer) and accurate, coordinated Point & Figure and Fibonacci projections -- are combined with other methodologies to bring you weekly reports and frequent daily updates.
“By the Law of Periodical Repetition, everything which has happened once must happen again, and again, and again -- and not capriciously, but at regular periods, and each thing in its own period, not another’s, and each obeying its own law … The same Nature which delights in periodical repetition in the sky is the Nature which orders the affairs of the earth. Let us not underrate the value of that hint.” -- Mark Twain
You may also want to visit the Market Turning Points website to familiarize yourself with my philosophy and strategy.www.marketurningpoints.com
Disclaimer - The above comments about the financial markets are based purely on what I consider to be sound technical analysis principles uncompromised by fundamental considerations. They represent my own opinion and are not meant to be construed as trading or investment advice, but are offered as an analytical point of view which might be of interest to those who follow stock market cycles and technical analysis.
Andre Gratian Archive |
© 2005-2022 http://www.MarketOracle.co.uk - The Market Oracle is a FREE Daily Financial Markets Analysis & Forecasting online publication.