


U.S. Dollar and Crude Oil Hold Clues About Stock Market Future
Stock-Markets / Financial Markets 2012 Mar 05, 2012 - 01:51 AM GMTBy: J_W_Jones

 The past few months have been a difficult environment for anyone that was bearish. The next few months may prove to be difficult for everyone regardless of directional bias.
We live in a world where headlines can move the market in split seconds as high-frequency trading robots cause flash rally's and flash crashes regularly.
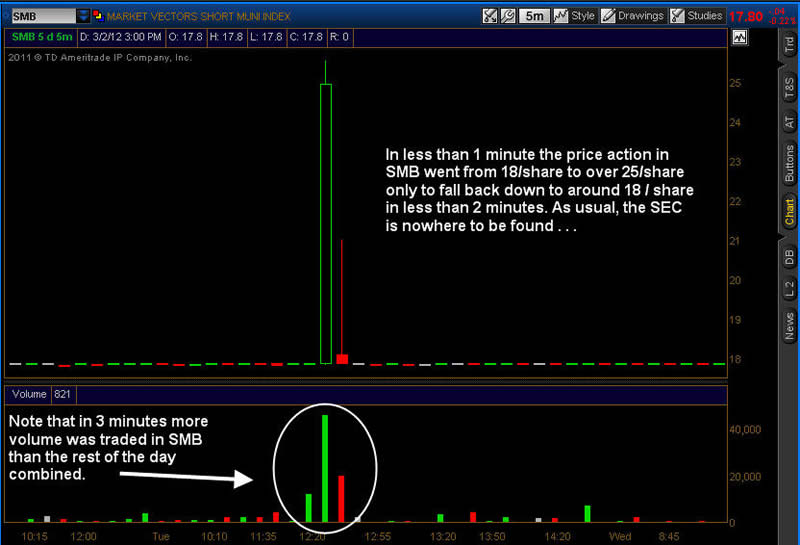
As an example, the price action in the Market Vectors Short Muni Index (SMB) on February 28th demonstrates the impact that these high frequency traders have on illiquid underlying assets.
We certainly hope there were not any absent minded retail investors that got caught using market orders during the flash rally only to recognize losses as great as 5% or more in a matter of minutes.
The following chart illustrates a flash rally and the monster 40% plus rally witnessed in less than 1 minute. Can someone say fat-finger mistake?
Market Vectors Short Muni Index 1-Minute Chart
In addition to high-frequency trading, we have to constantly monitor the headlines coming out of Europe as one event or official statement has the potential to cause the Euro to rally or selloff almost instantly whether the information is fact or fiction.
We have traded small for the most part during the beginning of 2012 as market conditions have been volatile even if the volatility index (VIX) has not necessarily supported that view.
One after another, perma-bears have capitulated to the bullish camp and now we have pundits calling for the Dow Jones Industrial Average to move over 15,000 by the end of the year.
We both use strategies which in many cases would be considered contrarian by nature. Admittedly we will not get every move in the market correct, but what we will do is layout key areas that price action should migrate to in the form of key price levels across short, intermediate, and long term time frames.
Our objective is to provide readers and our members with actionable information which can be viewed objectively by both bulls and bears alike. With that said, the following viewpoint we have of the marketplace today runs contrary to the collective group of market pundits.
While most market pundits expect higher prices and stronger economic data, there is reason to believe that recent developments could be indicating that volatility may lurk ahead. Volatility could rise up and push equity valuations lower in the near term.
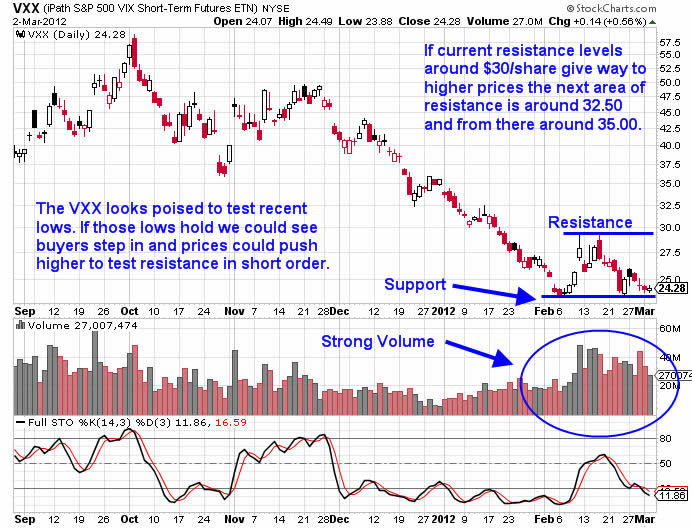
The daily chart of the Ipath S&P 500 VIX Short-Term Futures ETF (VXX) shown below illustrates that the VXX has seen strong volume in the past few weeks. Additionally the VXX appears to be trying to form a bottom.
With volatility at these levels, put protection is cheap and it would appear based on volume that the smart money is getting long volatility. Long VXX trades are designed to either act as a portfolio hedge or as a potential profit mechanism should a correction play out.
Ipath S&P 500 VIX Short-Term Futures (VXX) Daily Chart
By now most readers are aware of the rally that has been taking place in oil futures for the past few weeks. Nancy Pelosi came out with a statement blaming those evil speculators again while Republican Presidential hopefuls used higher oil prices as another key political topic against the current administration.
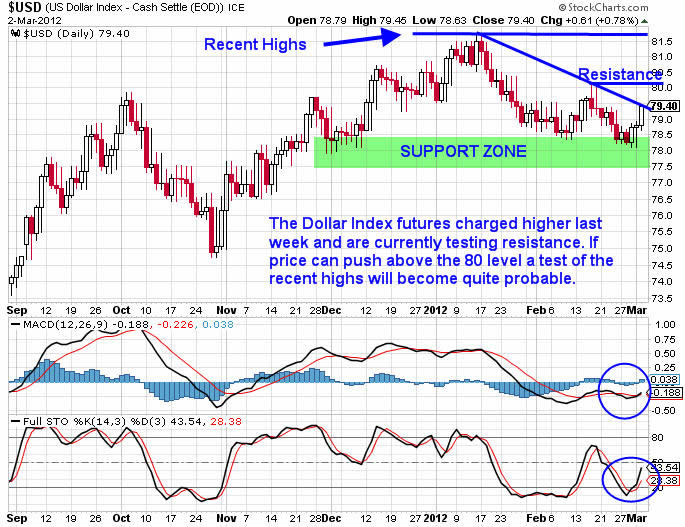
Just when the noise was starting to rise to a roar, the marketplace was quieted by a rally in the U.S. Dollar on February 29th. The daily chart of the Dollar Index futures is shown below.
Dollar Index Futures Daily Chart
Do readers find it rather odd that just about the time when oil was on the lips of every media personality in the United States that the Federal Reserve issues a reverse-repo to pull in liquidity? Do you find it at all coincidental or could it be that Mr. Bernanke was told to slow down the rally in oil prices?
After the reverse-repo was performed, the Dollar soared higher and was showing continuation to the upside on Friday afternoon during intraday trade. The Dollar is potentially forming a bottom presently and the fact that the Federal Reserve is aiding in that formation presents additional risk for downside in the S&P 500 Index and precious metals in the near term.
For the past several weeks the U.S. Dollar Index has pulled back and the S&P 500 definitely took notice. However, the Dollar is on the verge of carving out a weekly swing low which could have legs to much higher prices.
While many pundits routinely mock the Dollar and trash it, in the event of a major currency or credit event in Europe the Dollar will be one of the key safe havens that large sums of wealth will migrate too.
If the Dollar Index Futures can push through the downtrend line illustrated on the chart above with strong supporting volume a much larger move higher will likely play out. Should that scenario play out, the S&P 500 Index will likely begin to rollover.
It should be noted that the S&P 500 has struggled on multiple occasions to break above the key 2011 highs. The S&P 500 Index daily chart below demonstrates the resistance directly above current price action.
S&P 500 Index Daily Chart
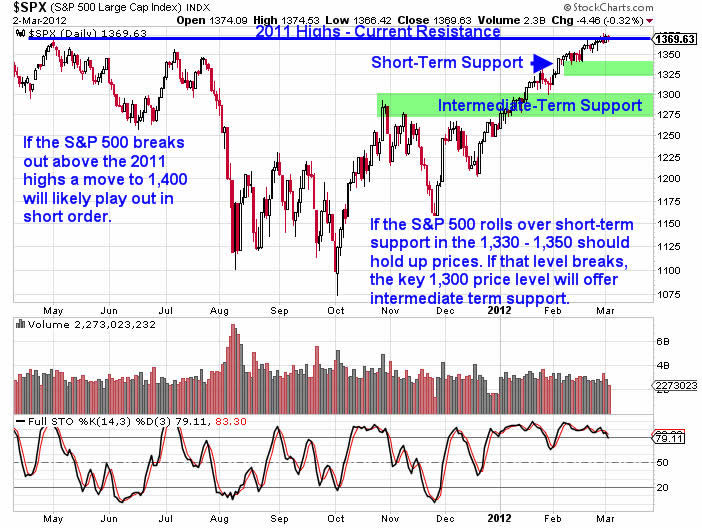
We have been bearish on the S&P 500 since price was testing the 1,330 price level. After the subsequent breakout we targeted the key 2011 highs as a last stand for the bears. If the Dollar finds a bottom and rallies sharply higher from current levels a correction in the S&P 500 will likely play out.
The other possibility would be a breakout over current resistance levels which would likely see the S&P 500 move to the 1,400 level if not higher in a matter of a few weeks. We are not leaning in either direction in terms of price action currently, but we are expecting the VIX to move higher in coming weeks and months ahead.
In our most recent collaborative missive, we discussed the fundamental case for gold prices going higher over the long term. Cleary the price action this week (specifically the price action on Wednesday February 29th) has been bearish and we expect to see prices chop around with a potentially bearish view for the next few months.
Gold Futures Daily Chart
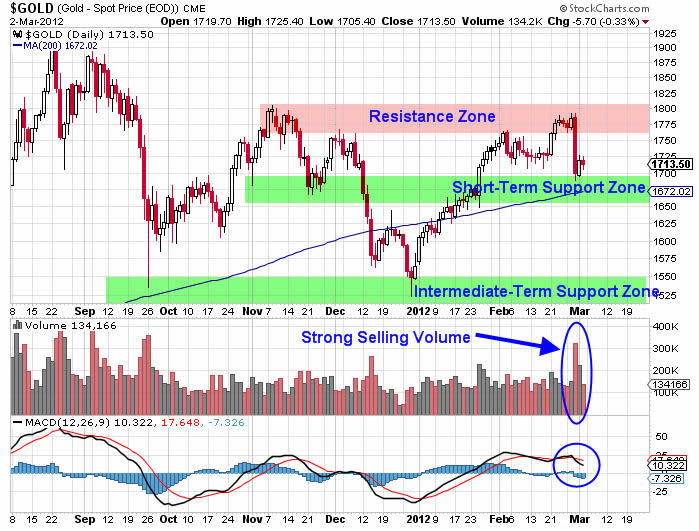
While gold has pulled back sharply, the likely move lower in coming weeks and months ahead will offer a strong buying opportunity for investors that are patient. If the Dollar breaks out to the upside which we anticipate, gold should move down into a significant low.
Should this scenario play out an entry point near the low will likely offer strong upside potential. In fact, it might be the last deep low before a prolonged period of choppy price action until the Dollar tops.
We firmly believe that as long as central banks continue to print money with wreckless abandon, the fundamental case for gold remains quite strong in the longer term.
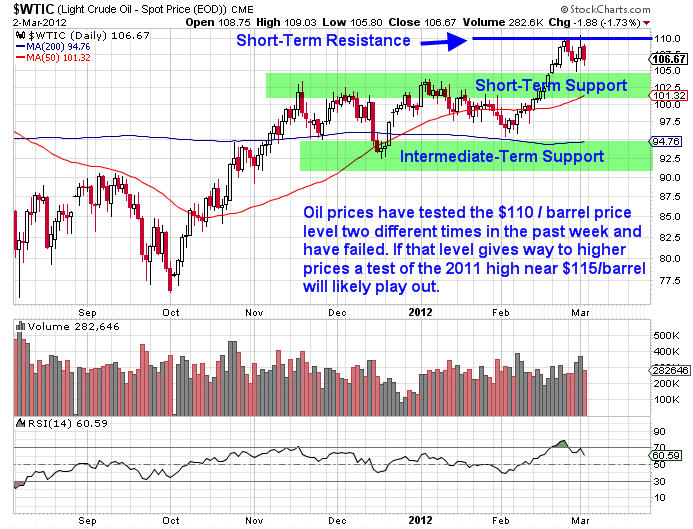
We have received a lot of emails recently asking about our opinions on the future price action in oil. Even though the Dollar may breakout to the upside, oil has a risk premium built into the price already for potential geopolitical conflict. However, military action in the Middle East could easily push prices higher.
Should oil push higher and test the 2011 highs and breakout to the upside, the likely results will be a weakening in the domestic economy as gasoline and diesel prices would surge higher. A surge in oil prices has a direct implication to the domestic U.S. economy as the cost for nearly everything will rise. The daily chart of oil futures is shown below.
Oil Futures Daily Chart
Conclusion
Ultimately we believe the two most critical assets to monitor at this time are the U.S. Dollar and oil futures. The U.S. domestic economy cannot handle significantly higher oil prices from the current levels without seeing business growth slow. Furthermore, if the Dollar rallies it could put pressure on the equity markets as well.
While the equity markets and the economy are not the same thing, it is important to note that higher oil prices at a certain point will become equity negative.
The VIX is sending a warning that market participants are too complacent and the Dollar is potentially forming a rounded out bottom. These two conditions paired with geopolitical risk in the Middle East represent additional risks to economic growth.
Furthermore, market participants cannot become complacent regarding the potential risk that Europe still poses. With the various risks listed above in mind, we are keeping position sizes small and are attempting to remain Delta neutral in our portfolios. Risk is beginning to elevate to extremes.
Join My Premium Options Writing Trading Service to Start Earning Monthly Income: http://www.optionstradingsignals.com/signup.php
J.W. Jones is an independent options trader using multiple forms of analysis to guide his option trading strategies. Jones has an extensive background in portfolio analysis and analytics as well as risk analysis. J.W. strives to reach traders that are missing opportunities trading options and commits to writing content which is not only educational, but entertaining as well. Regular readers will develop the knowledge and skills to trade options competently over time. Jones focuses on writing spreads in situations where risk is clearly defined and high potential returns can be realized.
This article is intended solely for information purposes. The opinions are those of the author only. Please conduct further research and consult your financial advisor before making any investment/trading decision. No responsibility can be accepted for losses that may result as a consequence of trading on the basis of this analysis.
© 2005-2022 http://www.MarketOracle.co.uk - The Market Oracle is a FREE Daily Financial Markets Analysis & Forecasting online publication.