


Stock Market Uptrend Topping
Stock-Markets / Stock Markets 2012 Feb 26, 2012 - 03:56 AM GMTBy: Tony_Caldaro

 Another quiet week in the US equity market as the entire range for the week was between SPX 1352 and 1369. While the SPX did not make a new print high, above 1371, it did make a new closing high for the bull market. Now all four major US indices are in new bull market territory. For the week the SPX/DOW were +0.3%, and the NDX/NAZ were +0.6%. Asian markets gained 0.4%, European markets lost 0.2%, and the DJ World index was +0.9%. On the economic front it was a quiet mixed week. On the uptick: consumer sentiment, new home sales, the WLEI, and the monetary base made a new high. On the downtick: existing home sales, FHFA housing prices, the M1 multiplier, and weekly jobless claims rose. Next week we’ll get a look at the first revision of Q4 GDP, the FED’s beige book, Case-Shiller and PCE prices. Best to your weekend and week!
LONG TERM: bull market
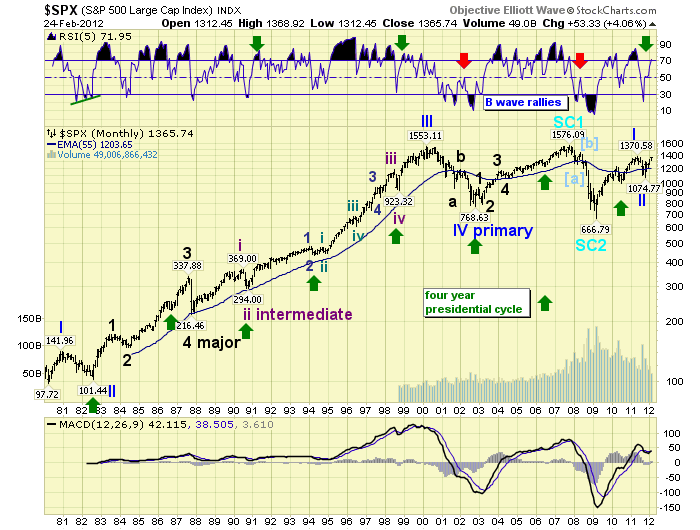
With the DOW crossing the 13,005 threshold on friday, historically, and that’s going back over 80 years, this advance from the early October low can no longer be considered a potential Major wave B of an ongoing bear market. As a result we have removed that count and now have all four major US indices in bull markets. Our indicators on the monthly chart continue to rise in a bullish manner.
On the weekly chart we have more of the same. A rising and above neutral MACD, with a rising and now quite overbought RSI. Notice how previous bull market uptrends, of the past 10 years, have peaked both above and below the current RSI level.
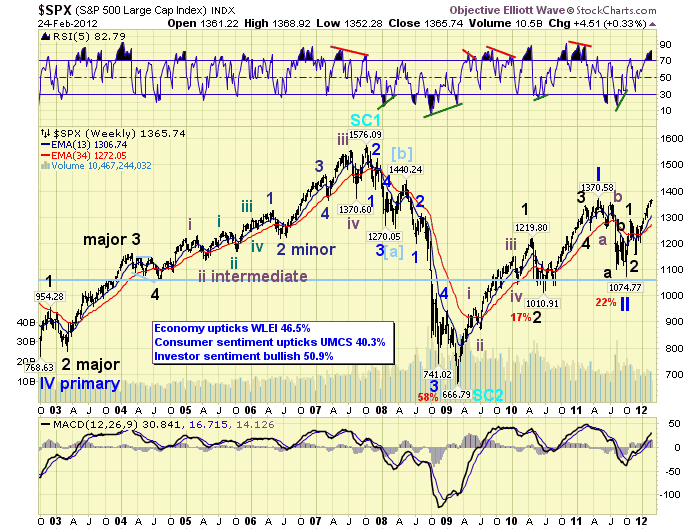
Our current bull market count, as you can see, remains the same. A Supercycle wave 2 low in Mar09 at SPX 667. A multi-generational Supercycle wave 3 began at that time. This bull market should be Cycle wave [1] of a five cycle wave supercycle bull market. Primary I completed in May11 at SPX 1371, and Primary wave II in Oct11 at SPX 1075. Primary wave III has been unfolding since that low. Within Primary III we should have five Major waves. Major waves 1 and 2 completed in Oct11 at SPX 1293, and in Nov11 at SPX 1175 respectively. Major wave 3 has been underway since that low. We have been counting this uptrend, from that low, as Intermediate wave i. Major wave 3 should include five intermediate waves. In summary the market is currently in: SC 3, Cycle [1], Primary III, Major 3 and Intermediate wave i. We have put together a tentative roadmap for the rest of this bull market. But are waiting for a confirmed downtrend before making it public.
MEDIUM TERM: uptrend high SPX 1369
The current uptrend started in late November at SPX 1159. The market has risen in five Minor waves since that low to friday’s high, or 18% in three months. For the first time since this uptrend began a negative RSI divergence has appeared, along with a weakening MACD. Upside momentum is definitely waning. Our initial fibonacci target for Minor wave 5 was SPX 1367. At this level Minor 5 = 0.618 Minor 1. Our other targets, which are posted on the hourly chart, are SPX 1381, 1408 and 1432. The current high, SPX 1369, falls in between our two OEW pivots: 1363 and 1372. This suggests there is a lot of resistance around current levels.
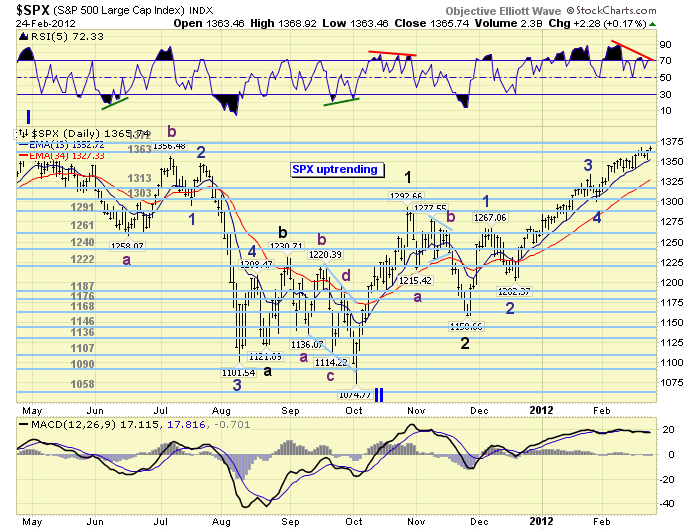
When this uptrend first began in November we expected it to last about three months and run into significant resistance just above the OEW 1313 pivot. In January that price target was hit during Minor wave 3. This suggested the next important resistance, after a small pullback, would be between the OEW 1363, 1372 and 1386 pivots. The SPX first entered the 1363 pivot range on February 15th. It has been 7 trading days, and the market has still not cleared this pivot. In early December, at Minor wave 1, the market spent only 4 trading days within the OEW 1261 pivot range before dropping 65 points. This pivot is definitely offering significant resistance.
SHORT TERM
Support for the SPX remains at the 1363 and 1313 pivots, with resistance at the 1372 and 1386 pivots. Short term momentum is displaying a negative divergence. As we tracked this uptrend we identified Minor wave 1 at SPX 1267, Minor 2 at SPX 1202, Minor 3 at SPX 1333, Minor 4 at SPX 1300, and Minor wave 5 underway. This uptrend, despite its three month duration, has not been that difficult to track. Now, however, we have arrived at an important juncture.
The internal wave structure of Minor wave 5 appears, at or, near completion. We can count five Minute waves up from the Minor wave 4 low. All rising Minor waves during this uptrend contained five Minute waves. We can also count five, complete or near complete, Micro waves within Minute wave v. It appears, on friday, this uptrend may have ended Micro wave 5, of Minute wave v, of Minor wave 5. This suggests a potential uptrend top is at hand. Heading into next week there are several technical parameters we are tracking.
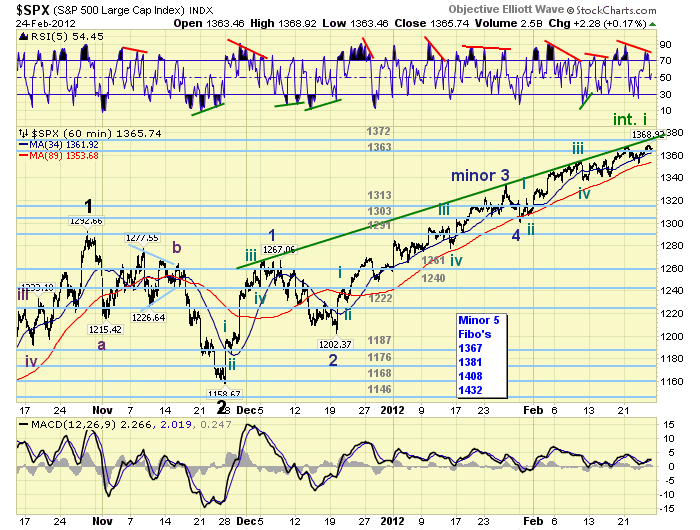
First, we have drawn on the hourly chart an overhead resistance trendline that has halted every rally during this uptrend. The market may try to tag that trendline again before heading lower, or even break through it if the uptrend is about to extend. Second, the market set up important support at SPX 1352 this week. Should the SPX trade below that level next week the uptrend has likely ended. Third, during this entire uptrend all pullbacks have been limited to 20 points or less, with the exception of Minor waves 2 and 4. Should the market break below, currently SPX 1349, the uptrend is likely over. In summary, there is trendline resistance in the low 1370′s, and two potential downtrend underway signals below SPX 1349 and 1352. Time to be cautious in this bull market.
Short term support is at the OEW 1363 pivot, then SPX 1352 and 1341. Overhead resistance is at the 1372 and 1386 pivots. Momentum displays negative divergences on every timeframe up to, and including, the daily charts. The short term OEW charts will turn negative with a drop into the low 1350′s. Next week should be quite important for this uptrend. Best to your trading!
FOREIGN MARKETS
The Asian markets were mixed on the week for a net gain of 0.4%. All uptrending.
The European markets were also mixed for a net loss of 0.2%. All uptrending.
The Commodity equity group was mixed as well for a net gain of 2.1%. All uptrending.
The DJ World index is still uptrending with a gain of 0.9% on the week.
COMMODITIES
Bonds continue to display a weakening uptrend but gained 0.2% on the week.
Crude soared 5.0% this week extending its uptrend to $110.
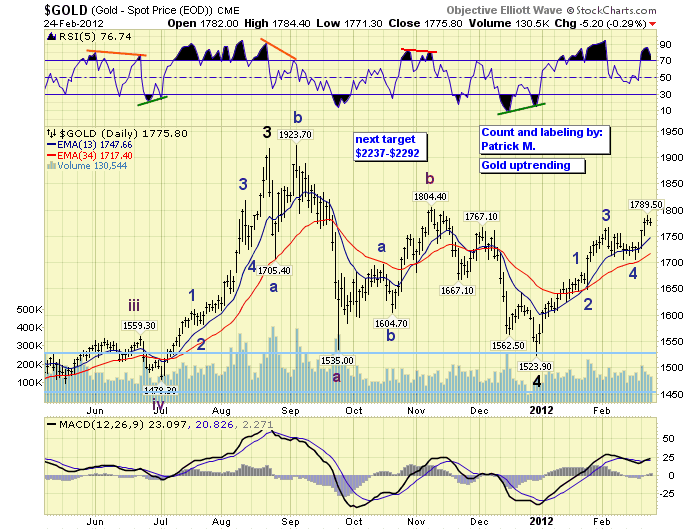
Gold rose 2.9% for the week extending its uptrend, but has reached an interesting juncture. Should our posted five wave count be correct the uptrend may be nearing an end. If another count we are tracking is in play, then another $100 higher should push gold toward $1900. So we have about $100 risk on the downside from here, or a $100 rally and then the $100 risk. Probability suggests we are currently in a 50/50 situation.
The USD lost 1.2% on the week as its downtrend continues. The EUR gained 2.3% on the week but is nearing resistance around 135.50 and is quite overbought. The JPY lost 1.9%, and appears to be in the process of breaking its multi-year uptrend.
NEXT WEEK
Monday kicks off the week with Pending home sales at 10:00. On tuesday we have Durable goods orders, Case-Shiller and then Consumer confidence. Wednesday looks important, Q4 GDP, the Chicago PMI, and the FED’s beige book. On thursday, weekly Jobless claims, Personal income/spending, PCE prices, ISM manufacturing, Construction spending, and monthly Auto sales. It’s testimony week for the FED. On tuesday, FED governor Duke testifies before the Senate on Housing. Then on wednesday, FED chairman Bernanke testifies before Congress on Monetary policy. Best to your weekend and week!
CHARTS: http://stockcharts.com/...
http://caldaroew.spaces.live.com
After about 40 years of investing in the markets one learns that the markets are constantly changing, not only in price, but in what drives the markets. In the 1960s, the Nifty Fifty were the leaders of the stock market. In the 1970s, stock selection using Technical Analysis was important, as the market stayed with a trading range for the entire decade. In the 1980s, the market finally broke out of it doldrums, as the DOW broke through 1100 in 1982, and launched the greatest bull market on record.
Sharing is an important aspect of a life. Over 100 people have joined our group, from all walks of life, covering twenty three countries across the globe. It's been the most fun I have ever had in the market. Sharing uncommon knowledge, with investors. In hope of aiding them in finding their financial independence.
Copyright © 2012 Tony Caldaro - All Rights Reserved Disclaimer: The above is a matter of opinion provided for general information purposes only and is not intended as investment advice. Information and analysis above are derived from sources and utilising methods believed to be reliable, but we cannot accept responsibility for any losses you may incur as a result of this analysis. Individuals should consult with their personal financial advisors.
© 2005-2022 http://www.MarketOracle.co.uk - The Market Oracle is a FREE Daily Financial Markets Analysis & Forecasting online publication.