


Did the SP500 just peak at 1356?
Stock-Markets / Stock Markets 2012 Feb 16, 2012 - 12:22 PM GMTBy: David_Banister

 This is somewhat of a things that make you go hmmmmmm exercise, but lets examine this 1356 number for a second here. The SP 500 hit 1356 today and put on the brakes and reversed down to 1341 in a possible terminal top move.
1356 actually has fibonacci relationships. If we take the last major rally which was from the Summer 2010 lows:
1010-1370 (May 2011 highs)
360 points
.786 of 360 is 283 points
Take 283, add it to the 1074 October lows…. you got 1356/57
That would mean this last rally so far is .786 of the 2010-11 rally.
Also, 1356/57 is right in my 1352-1376 pivot ranges for a Major 3 top as well
Evidence is mounting for a good sized correction here is my point.
Possible count, though many will argue not valid:
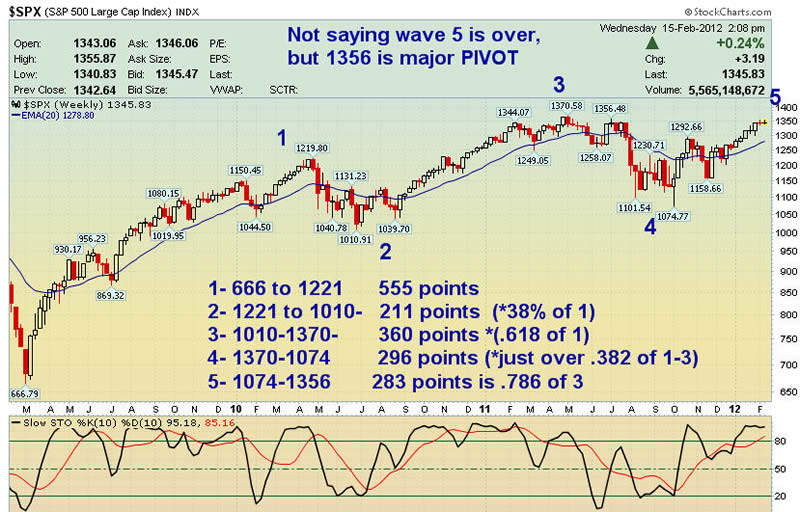
Wave 1- 666 to 1221- 555 points
Wave 2- 1221-1010- 211 points, .38% of 1
Wave 3- 1010-1370 360 points, .61% of 1
Wave 4- 1370-1074- 296 points… 38% of 1-3 (A bit more than 38%)
Wave 5- 1074-1356 .786 of 3
Only rule violation here is Wave 4 would have delved into wave 1, which is a no-no for most E wavers. However, I would argue that 4 often does delve into the wave 1 arena and legitimately, but that is a topic for another article.
Nonetheless… pay attention to the fibonacci relationships… if anything they may be warning of 1356 as an interim high and top with correction starting. This would either be a 4th wave down with the 5th and final wave up left… or we topped at 1356. A drop below 1337 will confirm a correction at minimum to 1310 and then 1295 ranges. Otherwise, we still have room on the upside near term to the 1363 and then 1376 pivots.
Just food for thought…we have been lightening our positions and raising stops at my ATP trading service. If you’d like to have regular updates on the SP 500, Gold and Silver so you can benefit from major pivots ahead of the crowd, check us out at www.markettrendforecast.com for a coupon offer
Dave Banister
CIO-Founder
Active Trading Partners, LLC
www.ActiveTradingPartners.com
TheMarketTrendForecast.com
Dave Banister is the Chief Investment Strategist and commentator for ActiveTradingPartners.com. David has written numerous market forecast articles on various sites (MarketOracle.co.uk, 321Gold.com, Gold-Eagle.com, TheStreet.Com etc. ) that have proven to be extremely accurate at major junctures.
© 2012 Copyright Dave Banister- All Rights Reserved
Disclaimer: The above is a matter of opinion provided for general information purposes only and is not intended as investment advice. Information and analysis above are derived from sources and utilising methods believed to be reliable, but we cannot accept responsibility for any losses you may incur as a result of this analysis. Individuals should consult with their personal financial advisors.
© 2005-2022 http://www.MarketOracle.co.uk - The Market Oracle is a FREE Daily Financial Markets Analysis & Forecasting online publication.