


Why Does The Stock Market Keep Rising?
Stock-Markets / Stock Markets 2012 Feb 12, 2012 - 07:44 PM GMTBy: LongWave

 This gigantic flood of extremely inexpensive high-powered money does have a major impact, not in the real economy, but in the liquid investment markets.
Free money sets a very low hurdle for a short-term investment and as long as the transaction has decent liquidity, why not do the trade. As a result, almost every equity, commodity, and credit market is moving higher.
High beta currencies are moving higher as well, as risk is clearly on the front foot. This positive mood began at the start of October, a bit more than a week after Bernanke announced the start of ‘Operation Twist,’ a subtle way to improve the profits of the banks and increase the risk of the Fed without expanding its balance sheet.
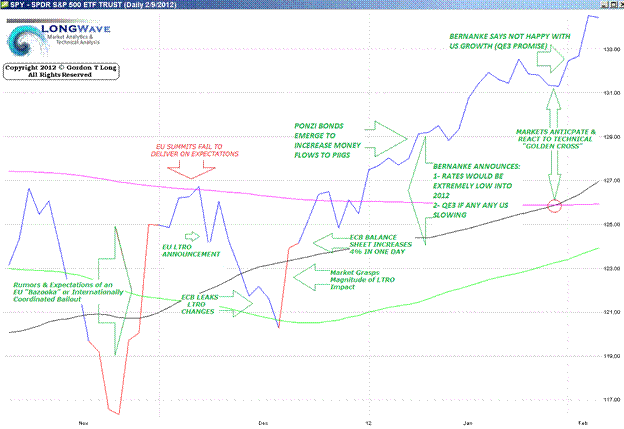
Global equity markets began to climb.
- Bernanke then announced an expansion and cheapening of the US swap lines with Europe, which currently have $103 billion outstanding, adding massively to Europe and Japan’s liquidity.
- Mario Draghi’s move into the ECB Presidency on November 1 was the next harbinger of a new wave of liquidity, as he dropped the refinancing rate a few days later.
- Then Draghi announced the LTRO on December 8, expanding the ECB balance sheet by over 4% of the GDP in one day later in the month.
- By the end of December things were clearly moving up in all the traded markets.
- Bernanke put the cherry on the top of the sundae not once, but several times in the last few weeks.
- First, he announced that US rates would be extremely low into late 2014,
- Then, a bit later, he emphasized the likelihood of QE3 if there were any economic pause,
- Then Tuesday he told the US Senate that he was not happy with the way the economy was growing – more hopes for QE3.
FOLKS, WE ARE JUST GETTING STARTED HERE!
$10 Trillion increase in Central Bank Balance Sheets
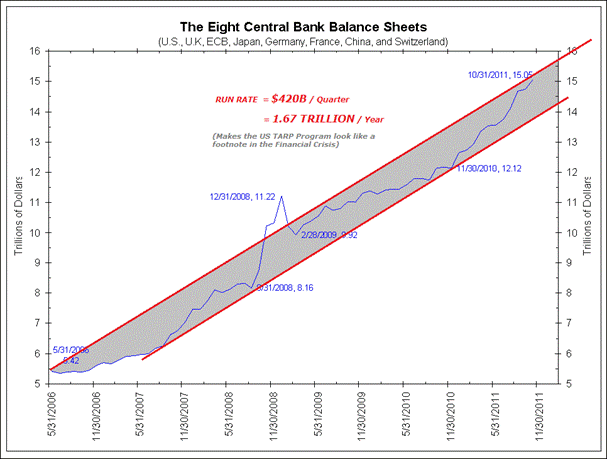
This is a rate of $5 Trillion in 3 years since the fall of 2008 or 1.67 Trillion per year.
This means in the last 90 days of market lift there has been $420 Billion of 'hot money'.
This is nearly the size of the US $700 Billion TARP program which took 18 months to implement.
As the markets always respond to monetary stimulus when the trend is already positive, prices will be forced even higher. Although we can’t be positive about the real economy, this expanding liquidity will keep us happy until a political accident intervenes.
Europe offers some candidates: Greece in March, followed by France in April.
CANARIES IN THE COAL MINE
Here is the real shocker and what is most alarming.
THE MONEY IS NOT FLOWING INTO THE US STOCK MARKET!!!!
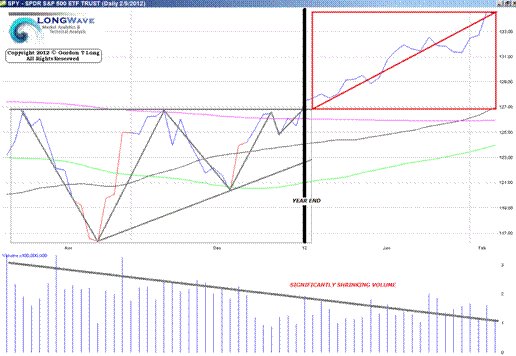
Rising markets do not demonstrate the following characteristics which are highlighted with charts in this month's Market Analytics & Technical Analysis report.
- No Volume & contracting,
- Low Volatility & shrinking,
- Contracting Margin,
- Contracting Short Positions,
- Historically elevated Overbought readings.
So how could the market rise then? Below is our initial chart with a different perspective.
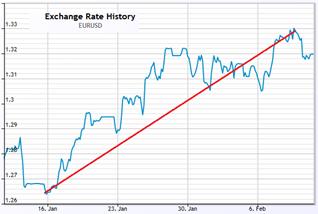
The red area of the S&P 500 (SPY Spyder ETF) chart above reflects an approximate 6% rise. The chart to the right, of the US$:Euro cross, shows a 6% rebound in precisely the same time frame.
Clearly, the move in US equities has been a US dollar devaluation move.
The real queston is where is the money flowing to? The answer is back to Central Banks custodial accounts and acceleratingly to Asia as a risk-off interest swap derivatives hedge. An exploding $88 Trillion increase in SWAPS must be hedged.
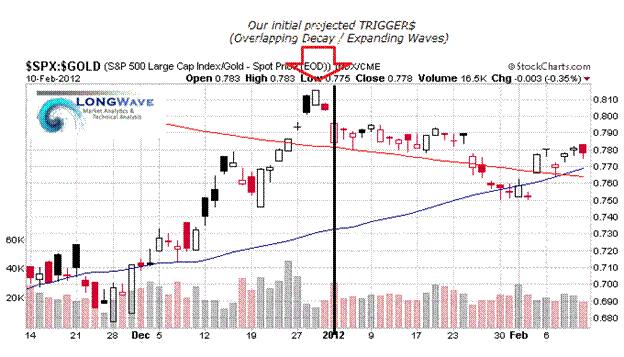
MARKET IN REAL TERMS
Another way to consider the move is to denominate the US stock market in something other than 'moving' US dollars. Below we have used Gold to represent a consistent 'store of purchasing power'. It illustrates the Trigger$ point we were expecting in late January.
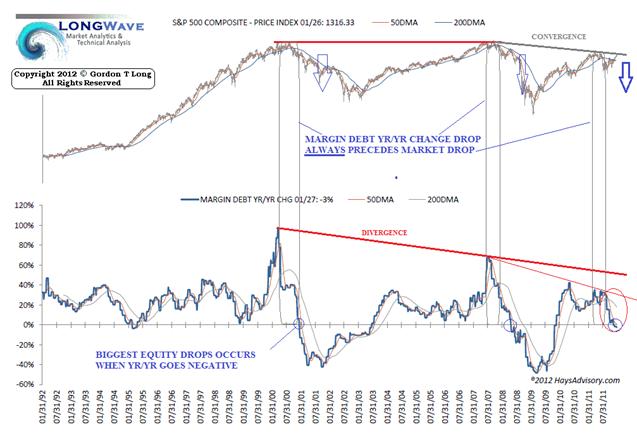
BEWARE OF A "FLASH CRASH"!
If the following two charts don't frighten you, then nothing from a technical analysis perspective likely will.
MARGIN HAS COLLAPSED - TRIGGER$ POINT
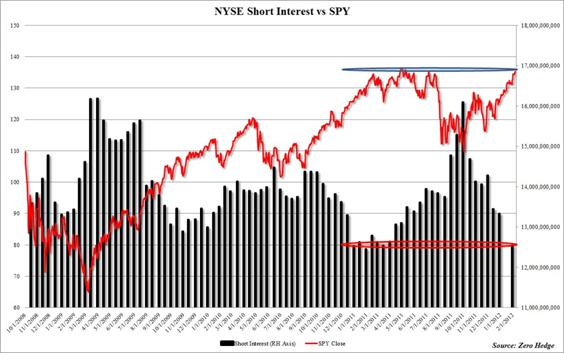
SHORT INTEREST HAS BEEN CRUSHED - TRIGGER$ POINT
According to the latest data, short interest has plummeted from a multi-year high in September of 16 billion shorts, which coincided with the market lows, to essentially the lowest print seen in the past 4 years at 12.5 billion shares. Players who look at short interest and covering as a market inflection point, see this as the signal for a market rolling over.
Something big is about to happen.
The EU is not even close to being fixed! It has been only temporarily 'medicated' with LTRO and Ponzi Bonds. Remember, when currency markets shift, the equity markets get crushed or go ballistic.
Good luck and good trading!
FREE copy of TRIGGER$ - Monthly Webzine for Traders >> FREE COPY
FREE Technical Audio Slide Presentations for Traders >> LONGWave
Publisher - LONGWave
Copyright © 2012 LONGWaveResearch - All Rights Reserved Disclaimer: The above is a matter of opinion provided for general information purposes only and is not intended as investment advice. Information and analysis above are derived from sources and utilising methods believed to be reliable, but we cannot accept responsibility for any losses you may incur as a result of this analysis. Individuals should consult with their personal financial advisors.
© 2005-2022 http://www.MarketOracle.co.uk - The Market Oracle is a FREE Daily Financial Markets Analysis & Forecasting online publication.