


Stock Market Uptrend Nearing a Top
Stock-Markets / Stock Markets 2012 Feb 12, 2012 - 06:41 AM GMTBy: Tony_Caldaro

 The US market was fairly quiet this week while trading in a narrow SPX 1336-1354 range. It did manage to reach marginal new uptrend highs on three of the days, but ended the week mixed. For the week the SPX/DOW were -0.35%, and the NDX/NAZ were mixed. Asian markets gained 0.3%, European markets lost 0.9%, and the DJ World index was -0.3%. Economic reports for the week were light, with results mixed. On the uptick: wholesale inventories, the monetary base, the WLEI, plus the budget deficit and weekly jobless claims improved. On the downtick: consumer credit, the M1 multiplier, the trade deficit, and consumer sentiment. Next week, options expiration week, we’ll get reports on retail sales, industrial production, the CPI/PPI and the FOMC minutes.
LONG TERM: bull market
After the diagonal triangle downtrend low at SPX 1075 in early October, we expected a 61.8% retracement of the entire May-Oct 2011 decline, to SPX 1258, during the next uptrend. The market rallied to SPX 1257 on October 24th, pulled back, and then made a one day surge to SPX 1293 to end the uptrend. This retracement uptrend, however, looked impulsive. And, not a corrective uptrend, which occur during bear market rallies. This suggested the five month correction may have ended at that early October low. The next downtrend would be the deciding factor. If impulsive, the correction/bear market was resuming. If corrective, the correction was over with a Primary wave II low.
The downtrend from late October to late November was corrective, with an ABC pattern into the November 25th low at SPX 1159. Primary wave II had ended in early October, and Major waves 1 and 2, of Primary III, had completed at SPX 1293 and 1159 respectively. The current uptrend, which started at that late November low, was then expected to run into significant resistance between SPX 1313-1327. It did run into resistance just above that range, with the high hitting SPX 1333, before the market pulled back. But this was only the third wave of the five wave uptrend. After a pullback to SPX 1300 the uptrend resumed into the 1350′s area this week. While Major wave 3, of Primary wave III, began at the late November SPX 1159 low. We still believe our current uptrend is only the first of the five Intermediate waves of Major wave 3.
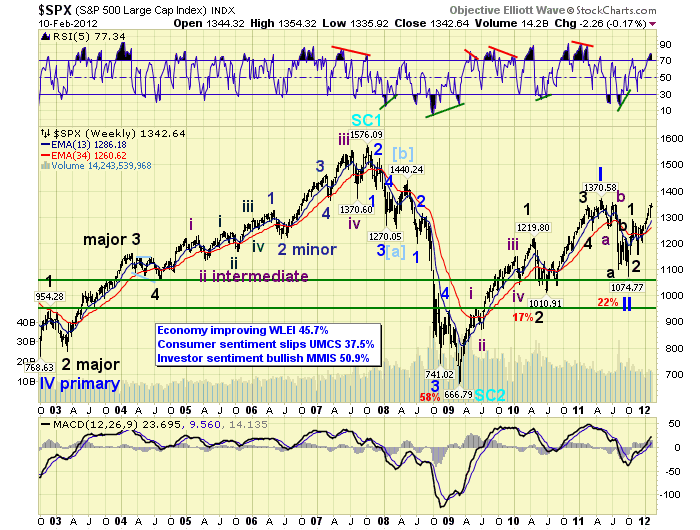
The technical indicators on the weekly chart continue to display the characteristics of a bull market. A rising MACD above neutral, and a rising RSI which is already quite overbought. In bear market rallies the RSI typically stops at slightly overbought, and the MACD does not rise above neutral. In bear markets the norm is an extremely oversold RSI accompanied by a declining, and below neutral, MACD.
MEDIUM TERM: uptrend high SPX 1354
The current uptrend, from the Nov11 SPX 1159 Major wave 2 low, is now in its third month. A three month timespan for uptrends, has been the normal time cycle within the rising waves in this bull market. One uptrend recently shortened to one month, and two others extended to six and seven months. But three months has been the norm. With this in mind we should be looking for an uptrend high this month. Then a one month correction. Which had also been the norm for corrections.
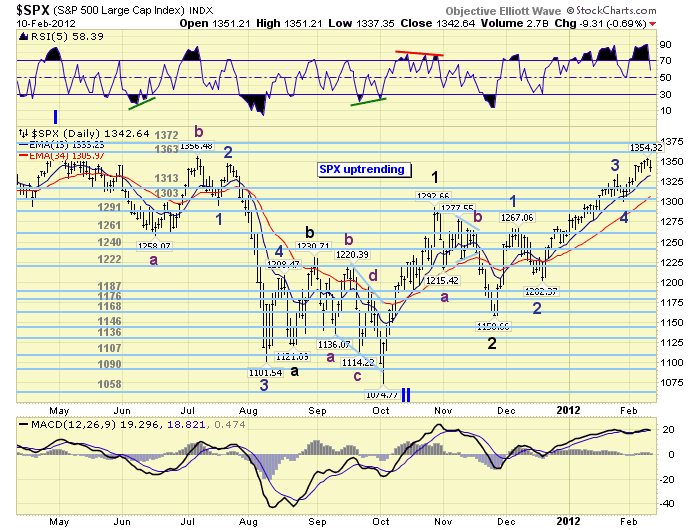
The current wave pattern suggests this uptrend has completed four Minor waves as noted on the daily chart: Minor 1 SPX 1267, Minor 2 SPX 1202, Minor 3 SPX 1333 and Minor 4 SPX 1300. We are currently in Minor wave 5, the last wave of this five wave uptrend. Last weekend we posted several Fibonacci price projections for an uptrend high, using the wave relationships within the uptrend and the first uptrend from the Oct11 low. We concluded the OEW pivot cluster at 1363, 1372 and 1386 would provide significant resistance. If exceeded, then SPX 1408 and the pivot at 1440 would offer the next levels of resistance. Currently, it does appear, the first pivot at 1363 could end this uptrend.
SHORT TERM
Support for the SPX is at 1313 and then 1303, with resistance at 1363 and then 1372. Short term momentum hit quite oversold friday morning, then set up a positive divergence. We have been tracking these five Minor waves, during this uptrend, with the subdivisions of five Minute waves within each rising Minor wave. Minor wave 1 was quite simple, with only Minute wave iii extending. Minor wave 3 was a bit more complicated as both Minute waves iii and v extended. Minor wave 5, thus far, has had a simple Minute wave i and an extended Minute wave iii. This is similar to Minor wave 1.
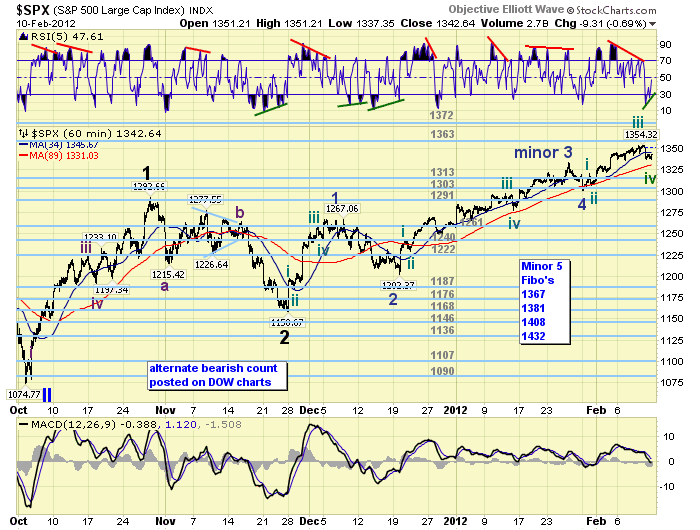
Friday’s decline helped confirm the expected Minute wave iii high at SPX 1354. For Minute wave iv we expected a small abc decline with support around SPX 1337/38. This appears to have occurred on friday. The market should now rally, in Minute wave v, possibly up to SPX 1361/65. These levels are based on the characteristics of this uptrend during similar types of pullbacks over the past three months. Short term support is at SPX 1333, 1321 and then the 1313 pivot. Overhead resistance is at SPX 1347, then the 1363 and 1372 pivots. Our short term OEW charts moved to a negative bias friday right after the open, then turned positive with support in the upper 1330′s. Best to your trading!
FOREIGN MARKETS
The Asian markets were mostly higher on the week for a net gain of 0.3%. All indices are in uptrends.
The European markets were mostly lower on the week for a net loss of 0.9%. All indices remain in uptrends.
The Commodity equity group was all lower on the week for a net loss of 1.7%. All indices remain in uptrends.
The DJ world index was -0.3% for the week, but remains in an uptrend.
COMMODITIES
Bonds continue their choppy uptrend ending the week about flat.
Crude was quite oversold last week in its downtrend, and rallied 2.1% this week.
Gold was quite choppy all week, still uptrending, but lost 0.3% on the week.
The USD continues to downtrend, but ended the week +0.2%.
NEXT WEEK
A heavy economic calendar on this options expiration week. On tuesday, Valentine’s day, Retail sales, Export/Import prices and Business inventories. Wednesday we have the NY FED, Industrial production, the NAHB housing index, and the FOMC minutes. On thursday, weekly Jobless claims, Housing starts, Building permits, the PPI and the Philly FED. Then on options expiration friday, the CPI and Leading indicators. As for the FED. On thursday FED chairman Bernanke gives a speech on community banking. Best to your week and weekend!
CHARTS: http://stockcharts.com/...
http://caldaroew.spaces.live.com
After about 40 years of investing in the markets one learns that the markets are constantly changing, not only in price, but in what drives the markets. In the 1960s, the Nifty Fifty were the leaders of the stock market. In the 1970s, stock selection using Technical Analysis was important, as the market stayed with a trading range for the entire decade. In the 1980s, the market finally broke out of it doldrums, as the DOW broke through 1100 in 1982, and launched the greatest bull market on record.
Sharing is an important aspect of a life. Over 100 people have joined our group, from all walks of life, covering twenty three countries across the globe. It's been the most fun I have ever had in the market. Sharing uncommon knowledge, with investors. In hope of aiding them in finding their financial independence.
Copyright © 2012 Tony Caldaro - All Rights Reserved Disclaimer: The above is a matter of opinion provided for general information purposes only and is not intended as investment advice. Information and analysis above are derived from sources and utilising methods believed to be reliable, but we cannot accept responsibility for any losses you may incur as a result of this analysis. Individuals should consult with their personal financial advisors.
© 2005-2022 http://www.MarketOracle.co.uk - The Market Oracle is a FREE Daily Financial Markets Analysis & Forecasting online publication.