


Stock Market Locked and Loaded
Stock-Markets / Stock Markets 2012 Feb 12, 2012 - 06:24 AM GMT

 Once again the freight train that is the US stock markets continues to push on higher, although there were some potential vital clues on Friday and something's that we are watching closely.
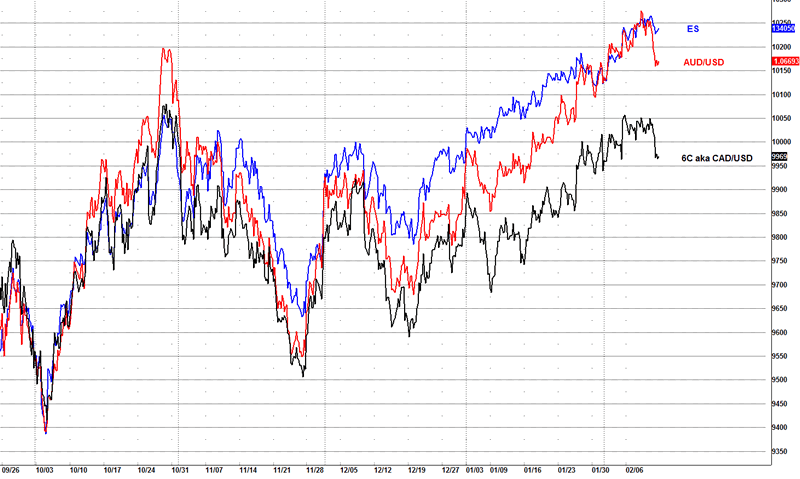
The risk FX pairs I like to follow showed some important price action that could be a vital clue for a reversal.
AUD/USD
After hitting my target window of 1.0760-1.0800 this pair decided to chop around for a few days and frustrate traders, although you can clearly see the wedge shape and I suspect that we could have an important high in play, although we do need a bit more early on Sunday/Monday to help confirm.
If the high is in that I have been looking for, a great move should be setting up in risk trends, so we are watching closely on the risk FX pairs.
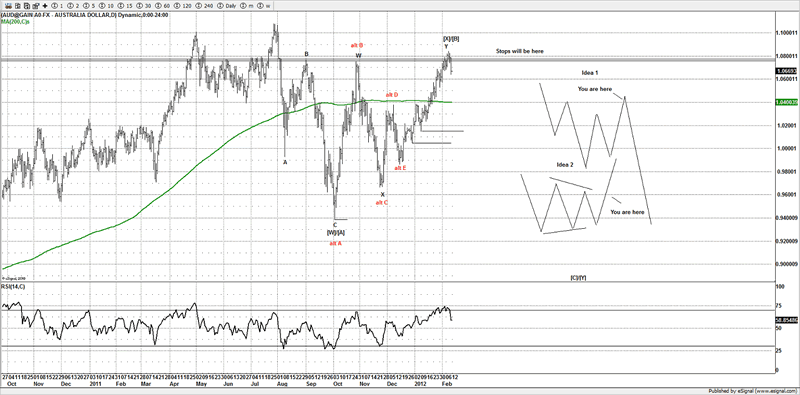
Friday put in a decent candle and one if we see some follow through early next week should see a heavier move, the bears are in business back under the 200DMA as that eliminates an alternative bullish idea of seeing this push on higher towards new all time highs. So it's important for the sellers to really pile on the trend now and push this under the 200DMA, (currently at 1.0400).
USD/CAD
Another pair that we have been watching closely is the USD/CAD pair, and the price action on Friday was encouraging, but we do need more upside over the coming days early next week, to help cement a low in place.
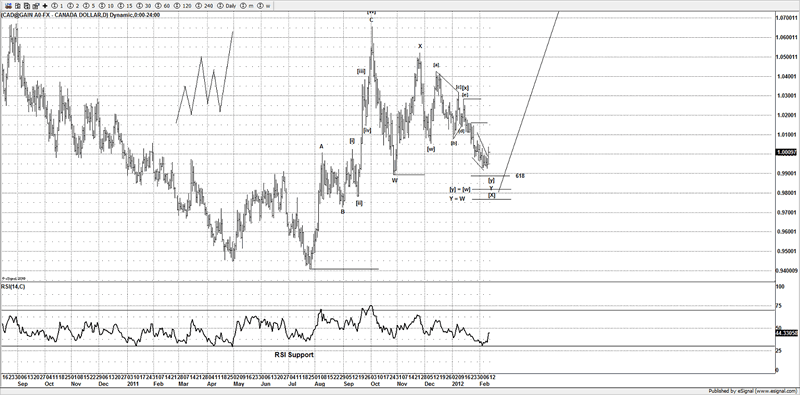
If the reversal that I am expecting has indeed started, then risk should be put under pressure and that should see other markets such as stocks come under pressure as well. It's encouraging to see the signs from the FX risk pairs on Friday, but overall more is needed to help cement a reversal in place.
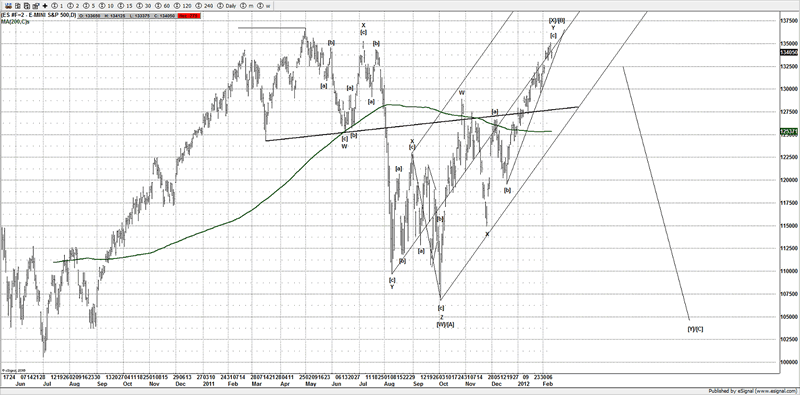
ES
We have been following this timing chart for a few weeks now, and it potentially could have signaled that it's ready to reverse, using the previous rallies and the DNA, we can calculate time and price targets.
Although day 53 is not until Sunday, but give or take a day, both time and price has been met, although there is scope for higher in stocks, as is there the potential to increase the time targets. The clues we saw from the USD/CAD and AUD/USD pairs, we tend to think could be an important sign and price trumps time, as the only thing that pays is price.
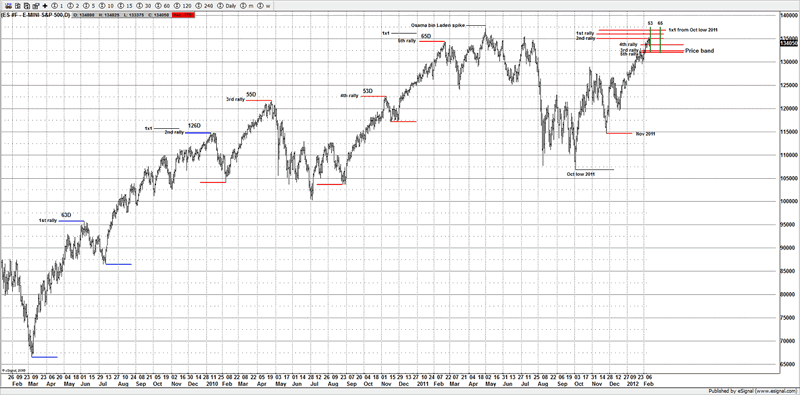
My preferred count still stands, although my reasons are more to do with the FX risk pairs as opposed to what was happening this week.
R.I.P Wave [3] to Dow 1000
Now the biggest thing to happen this week was the final confirmation that the bears that counted the move from the May highs into the Oct lows 2011, as a 5 wave move once again were duly duped.
The new high above the May 2011 highs, does not affect my overall ideas as I never considered the decline as a 5 wave move anyhow.
It has always been my opinion that it was a double or triple zig zag, and a corrective move, it was never a 5 wave decline as the internals do not support it.
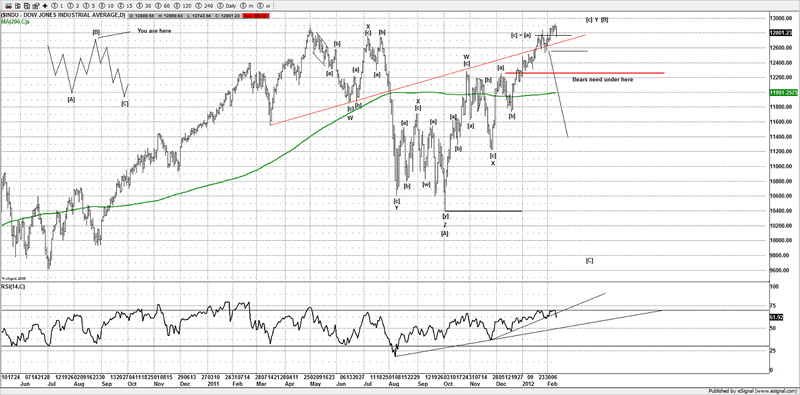
You will see that my preferred count has been that of a [W] (although added alt wave [A]) wave at the Oct lows 2011 and we have I suspect made a corrective bounce against the decline last year.
I still continue to believe that to be true. But even if it was not and we only see a correction to the Dec rally then I am happy to switch wave counts and more to my alternative from here, and embrace a move to the highs of Oct 2007.
But the move from the Dec lows is very extended and I suspect at the min should see a retrace towards 1290-1300ES, from there I can work out if the bulls really do have a solid case for a move towards the Oct 2007 highs.
My preferred count is still to test the Oct 2011 lows again, and those that are buying these highs are getting setup for a trap and about to be shaken out again.
It seems the sentiment readings are on par with the May 2011 highs, it was less than a year ago and most traders have forget what happens when the boat is so far to one side.
Can I be wrong, and this is about to go parabolic?
Sure and I will be the 1st to say so, but it's always about the level of risk, if you truly think we are going to push higher and never stop till we see 1600SPX then you buy here and look for higher prices.
Based on history and the DNA of the rallies, my work suggests that at minimum I would expect a move to 1290-1300ES even if this was part of a bullish set up, or my preferred route is a reversal and down to test the lows made on Oct 2011 again.
I don't have any issues ditching my preferred ideas and moving to my alternative, but buying the highs and looking higher, generally is a big mistake as if you get trapped like the previous highs at the April high in 2010 and May high in 2011, a world of pain can be expected if you get caught "holding the bag".
But then history shows time and time again, people seem to have amnesia with the markets and all that has happened before is forgotten.
Well I take very seriously sentiment and patterns and I am not interested in buying the highs, the time to buy was at 1200 as I expected and looked for a move to 1300-1320.
Now that we have arrived I am actively looking for a reversal based off some ideas and looking at a cross section of other markets such as AUD/USD, USD/CAD, Copper etc and other European markets such as the FTSE etc.
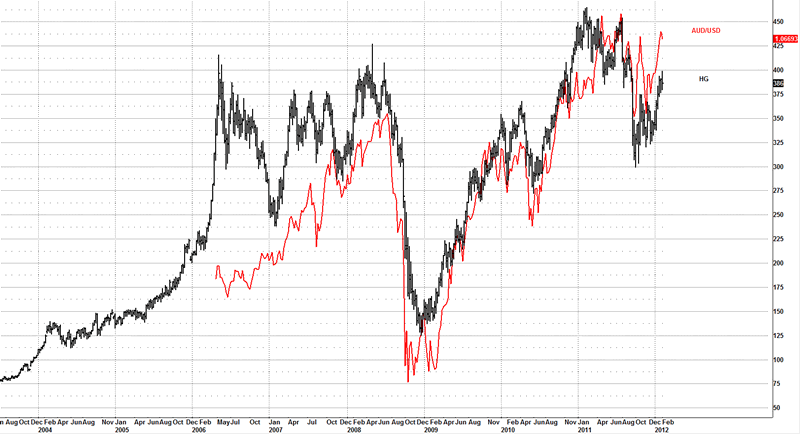
Copper (HG)
This market has been causing me some issues lately as the previous reversal proved to be a red herring and that of a small b wave of the wave [iv] triangle and we have put in a new high, but the reversal made this week, which looks again to be substantial and something to take note off, looks important, so we are watching for signs, with the AUD/USD pair suspected to have reversed and with Copper (HG) the same, there is some collective evidence that we might have a substantial high in place.
You can see how it's highly correlated to the AUD/USD pair, FTSE traders also may want to take note as the FTSE has many mining stocks in the FTSE 100.
Conclusion
There was some decent evidence to help cement a potential reversal in, although we need to see more follow though over the coming days, if we do have a reversal locked in, depending on what happens over the coming weeks will help decide if the bulls really do own the markets and about to take this market back to the Oct 2007 highs again.
Until next time.
Have a profitable week ahead.
Click here to become a member
You can also follow us on twitter
What do we offer?
Short and long term analysis on US and European markets, various major FX pairs, commodities from Gold and silver to markets like natural gas.
Daily analysis on where I think the market is going with key support and resistance areas, we move and adjust as the market adjusts.
A chat room where members can discuss ideas with me or other members.
Members get to know who is moving the markets in the S&P pits*
*I have permission to post comments from the audio I hear from the S&P pits.
If you looking for quality analysis from someone that actually looks at multiple charts and works hard at providing members information to stay on the right side of the trends and making $$$, why not give the site a trial.
If any of the readers want to see this article in a PDF format.
Please send an e-mail to Enquires@wavepatterntraders.com
Please put in the header PDF, or make it known that you want to be added to the mailing list for any future articles.
Or if you have any questions about becoming a member, please use the email address above.
If you like what you see, or want to see more of my work, then please sign up for the 4 week trial.
This article is just a small portion of the markets I follow.
I cover many markets, from FX to US equities, right the way through to commodities.
If I have the data I am more than willing to offer requests to members.
Currently new members can sign up for a 4 week free trial to test drive the site, and see if my work can help in your trading and if it meets your requirements.
If you don't like what you see, then drop me an email within the 1st 4 weeks from when you join, and ask for a no questions refund.
You simply have nothing to lose.
By Jason Soni AKA Nouf
© 2012 Copyright Jason Soni AKA Nouf - All Rights Reserved
Disclaimer: The above is a matter of opinion provided for general information purposes only and is not intended as investment advice. Information and analysis above are derived from sources and utilising methods believed to be reliable, but we cannot accept responsibility for any losses you may incur as a result of this analysis. Individuals should consult with their personal financial advisors.
© 2005-2022 http://www.MarketOracle.co.uk - The Market Oracle is a FREE Daily Financial Markets Analysis & Forecasting online publication.