


Different Measures of U.S. Unemployment, but Consistent Story is Visible
Economics / Unemployment Feb 09, 2012 - 02:56 PM GMTBy: Asha_Bangalore

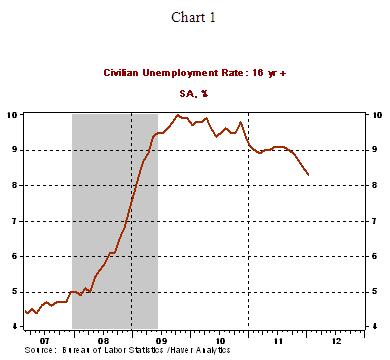
 The civilian unemployment rate declined to 8.3% in January from 8.5% in the prior month and is noticeably lower than the year ago reading of 9.1% (see Chart 1). The jobless rate in the Great Recession peaked at 10.0% in October 2009. The elevated unemployment after ten quarters of economic growth remains one of the top concerns of the Fed. Frequently, measures of unemployment different from the headline number are cited to drive home the message that the underlying fundamentals of the labor market are softer than what is inferred from the official rate. The aim of today’s comment is to sort out the different measures of unemployment and draw a meaningful conclusion of the status of the labor market.
The Bureau of Labor Statistics (BLS) estimates the unemployment rate from data collected from a monthly survey of households. Persons are considered unemployed if they do not have a job, have looked for a job in the past 4 weeks, and are currently available for work. By this definition, there were 12.758 million unemployed in January 2012. The civilian labor force (CLF) of the U.S. economy is 154.395 million. The unemployment rate is the number unemployed as a percent of the labor force.
How to Compute the Unemployment rate:
Unemployment rate = (Number unemployed/Civilian labor force) x 100 …….. (1)
Unemployment rate = (12.758/154.395)*100 = 8.3%
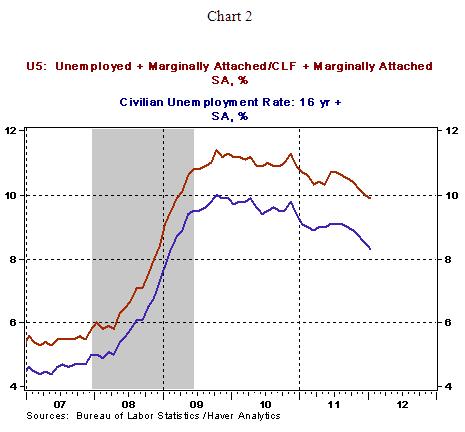
How about folks who are currently neither working nor looking for work but have been looking for job in the past year and indicate they want and are available for work? The BLS collects information about such folks and they are classified as “marginally attached to the labor force.” There were 2.809 million people classified as marginally unemployed in January 2012. The unemployment rate to account for those who have searched for a job in the past 4 weeks and for those who have looked in the past 12 months for a job is another measure of unemployment called as “U5.” The U5 unemployment rate is obtained by adding the number of marginally attached to the numerator and denominator of equation 1 because the definition of the number unemployed and the labor force changes when people who have been looking for a job during the past twelve months is taken into consideration. The U5 unemployment rate in January 2012 was 9.9%, down from 10.7% in January 2011 (see Chart 2).
U5 = [(12.758 million +2.809 million)/(154.395 million +2.809 million)] x 100
U5 = 9.9%
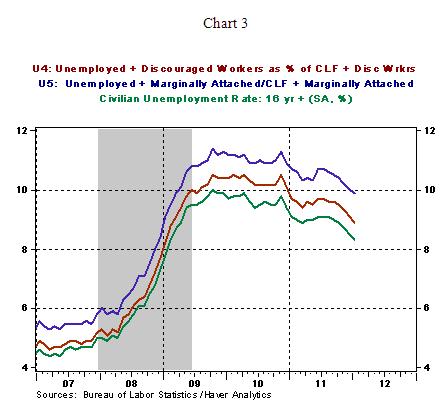
How about discouraged workers? Discouraged workers are a subset of the marginally attached workers and typically give a job-market related reason for not currently looking for work. The reasons could be that they believe work is not available, they cannot find work, they lack the necessary schooling or training, employer thinks they are too young or old, and other types of discrimination. According to BLS estimates, there were 1.059 million discouraged about job prospects in January 2012. Following the exercise as in computing U5, we can compute U4, which includes those officially unemployed (12.758 million) and discouraged workers (1.059 million) as percent of the labor force (154.395 million) and the number of discouraged workers (see Chart 3). U4 was 8.9% in January 20012, down from 8.7% in January 2011.
U4 = [(12.758 million + 1.059 million)/(154.395 million+1.059 million)] x 100
U4 = 8.9%
The main purpose of the tedious exercise on different measures of unemployment is to indicate that even after accounting for those who are discouraged and those who are looking for a job over an extended period but not discouraged, the labor market has turned the corner for the better. All three measures of unemployment show a nearly one percentage point reduction in past 12 months. Although U4 and U5 jobless rates are higher than the official rate, the noteworthy aspect of the latest unemployment readings, irrespective of which measure one uses, is that the recent trend is down not up or sideways.
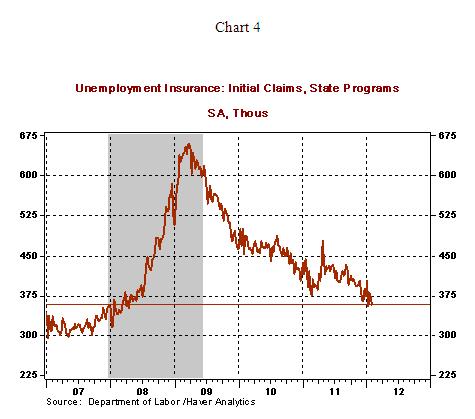
Also, the latest initial jobless claims numbers are indicative of an improving labor market. Initial jobless claims dropped 15,000 to 358,000 for the week ended February 4. The number of folks filing for unemployment insurance is now comparable to the level seen in April 2008 (see Chart 4). Continuing claims, which lag initial jobless claims by one week, increased i64,000 to 3.515 million. Pulling together information from three measures of unemployment and latest jobless claims numbers, the labor market has shaken off the negative tone of the past few months.
Asha Bangalore — Senior Vice President and Economist
http://www.northerntrust.com
Asha Bangalore is Vice President and Economist at The Northern Trust Company, Chicago. Prior to joining the bank in 1994, she was Consultant to savings and loan institutions and commercial banks at Financial & Economic Strategies Corporation, Chicago.
Copyright © 2012 Asha Bangalore
The opinions expressed herein are those of the author and do not necessarily represent the views of The Northern Trust Company. The Northern Trust Company does not warrant the accuracy or completeness of information contained herein, such information is subject to change and is not intended to influence your investment decisions.
© 2005-2022 http://www.MarketOracle.co.uk - The Market Oracle is a FREE Daily Financial Markets Analysis & Forecasting online publication.