


Learn How to Apply Fibonacci Retracements to Your Stock Index Trading
InvestorEducation / Stock Index Trading Feb 08, 2012 - 06:49 PM GMTBy: EWI

 Elliott waves often correct in terms of Fibonacci ratios. The following article, adapted from the eBook How You Can Use Fibonacci to Improve Your Trading, explains what you can expect when a market begins a corrective phase. Learn how you can read the entire 14-page eBook below.
Retracements -- Corrective Waves
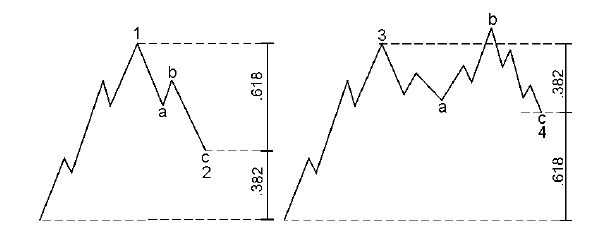
If we look on the left side of this chart, we see a diagram of wave 1 followed by wave 2. It is common for second waves to retrace .618 of wave 1 -- thereby making a deep retracement. We will also be looking for .786. We might often see .5, 50%, but .618 is common. On the right side, fourth waves will commonly retrace a smaller percentage or .382 of wave 3. We might also see something like .236.
Examples
I have put the wave count on this chart of the S&P 500. We have waves 1, 2, 3, 4 and 5. Wave 2 is an expanded flat. Wave 4 is a zigzag. Let's look at the retracements that waves 2 and 4 make.
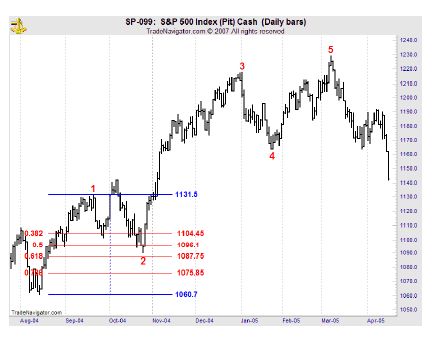
We see that wave 2 makes a deep retracement. It comes close to .618. Look at this Fibonacci table that I put up; notice that I put .382, .5, .618, and .786. .618 is 1087.75, and the S&P low is 1090.19.
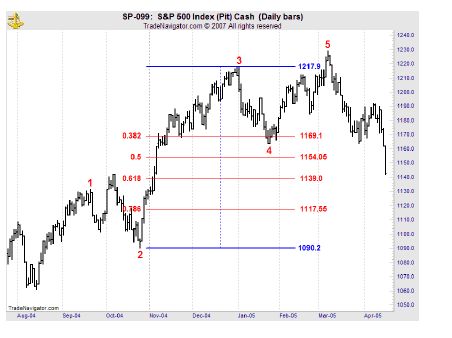
We see that wave 4 makes a shallow retracement of wave 3. It goes just beyond the .382 retracement. .382 is 1169.1, and wave 4 actually bottoms at 1163.75.
In a nutshell, this is what we mean when we say that Elliott waves often correct in terms of Fibonacci ratios.
|
Learn How You Can Use Fibonacci to Improve Your Trading If you'd like to learn more about Fibonacci and how to apply it to your trading strategy, download the entire 14-page free eBook, How You Can Use Fibonacci to Improve Your Trading. EWI Senior Tutorial Instructor Wayne Gorman explains:
See how easy it is to use Fibonacci in your trading. Download your free eBook today >> |

This article was syndicated by Elliott Wave International and was originally published under the headline Learn How to Apply Fibonacci Retracements to Your Trading. EWI is the world's largest market forecasting firm. Its staff of full-time analysts led by Chartered Market Technician Robert Prechter provides 24-hour-a-day market analysis to institutional and private investors around the world.
About the Publisher, Elliott Wave International Founded in 1979 by Robert R. Prechter Jr., Elliott Wave International (EWI) is the world's largest market forecasting firm. Its staff of full-time analysts provides 24-hour-a-day market analysis to institutional and private around the world.
© 2005-2022 http://www.MarketOracle.co.uk - The Market Oracle is a FREE Daily Financial Markets Analysis & Forecasting online publication.