


Stock Market Next Short-term Top in Sight
Stock-Markets / Stock Markets 2012 Feb 06, 2012 - 03:46 AM GMTBy: Andre_Gratian

 SPX: Very Long-term trend - The very-long-term cycles are down and, if they make their lows when expected, there will be another steep and prolonged decline into 2014.
SPX: Intermediate trend - Intermediate uptrend still intact.
Analysis of the short-term trend is done on a daily basis with the help of hourly charts. It is an important adjunct to the analysis of daily and weekly charts which discusses the course of longer market trends.
I apologize to those who were looking for this newsletter last week-end. My computer decided to take a break!
Market Overview
Based on cycles which were topping around the last week in January, I had expected a short-term top to form in the SPX. One did, and caused the biggest reversal since mid-December: a puny 33 points decline which lasted about two days!
The original projection for the move was around 1322. However, after reaching that target, the index made a small re-accumulation pattern which gave a projection to 1336. The cycle top finally came at 1333, just a little shy of the target.
Since then, the index has made a re-accumulation pattern above 1301 which bears a vague resemblance to an inverted H&S. From the P&F chart, we can derive several potential projections for the next move: 1346 - 1364 - 1374(?). The first gives us the minimum target which was almost reached on Friday (1345.34). If we remain above 1322 on the profit-taking pull-back and we start up again, the odds are pretty good that we'll reach about 1364 on the next attempt. Going all the way to 1374 would require exceptional short-term market strength and is, therefore, questionable.
And when would the next top occur? We'll have to let the market decide that. There are several short-term cycles clustering in the first week in March which could be either a market high or low. If a low, then the above projections will be reached sometime during this month. Considering the fact that we have already met the minimum projection, the odds probably favor a reversal sooner than the first week in March - unless most of February is spent building a distribution phase. In any case, I'll be sure to look for signs of a top starting next week, especially if we get to 1364.
When we look at the charts, we'll see that the market is more than ready for a top of greater consequence than anything since late November. This is also suggested by EW analysis.
Chart analysis
EW analysis is hardly a methodology that I claim to be my forte. After all, if Bob Prechter can't always get it right, what chance do I have? J But there is someone who does get it right the great majority of the time, and his name is Tony Caldaro (the Elliott Wave lives on). One of the reasons for his continued accuracy is that he is quick to adjust his labeling when required.
In this SPX Daily Chart, I have labeled the move from the 3-yr cycle low of early October according to his interpretation. If correct, we are getting ready to make a short-term top, a consolidation followed by a new high, and then we could expect an intermediate term correction. I can find nothing in my own comprehensive analysis that disagrees with that interpretation.
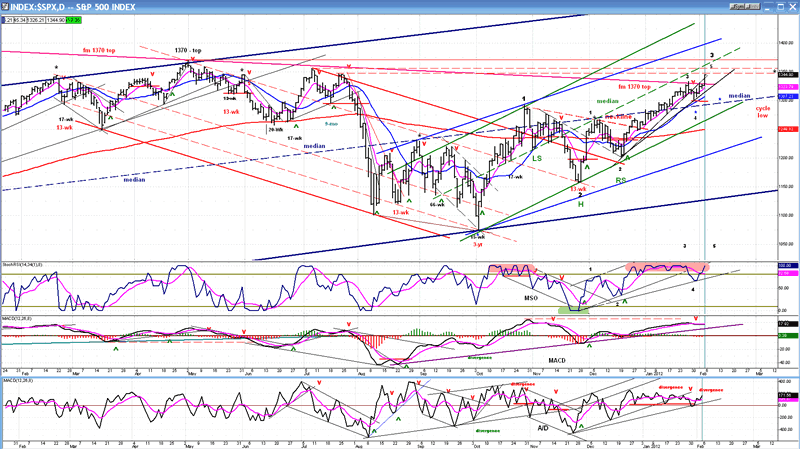
There is every indication that the bull market which started in March 2009 is still alive and well. The Russell 2000 made a new all-time high early last year, and the NDX just hit its highest level in over a decade. That is not representative of a stock market which is ready to make a long-term top. Perhaps late 2012 will be a better time frame for that.
The SPX is still trading below its 2007 high, but it is picking up strength and may soon be ready to overcome its 2011 high or 1370. The chart above shows that, since its 2009 low, it has been traveling in a broad channel (dark-blue trend lines) and has recently started trading in the upper half of the channel. Also significant is the fact that Friday, it overcame and closed above a long-term trend line from the 2007 top.
Within that long-term channel, the trend has become steeper and steeper. This is a sign of price acceleration, an indication that the SPX is getting stronger and stronger! Until that reverses into patterns of deceleration, we have no good reason to look for a bull market top. In fact, you could probably make the same argument for an intermediate top. This is why Tony's EW labeling is probably correct. We still need a short-term top followed by a short-term correction before we come to an intermediate top.
The green channel is of particular interest right now. I have drawn the median in a dashed line. If you look back, the price has touched it 5 or 6 times, each time finding either support or resistance. If the SPX continues to move up before making an important correction, there is a good chance that it will meet with resistance at the median, and the level where it would do so is about 1364, one of the projection targets derived from the recent re-accumulation phase. That would be a good place to look for a short-term top.
I have also drawn horizontal red lines from previous tops. These often turn into resistance levels.
The indicators reflect the overbought state of prices with the MSO tracing out the same 5 waves that appear in the index. The A/D continues to show negative divergence, and the MACD has now leveled out, all of which indicates that another short-term top is in sight.
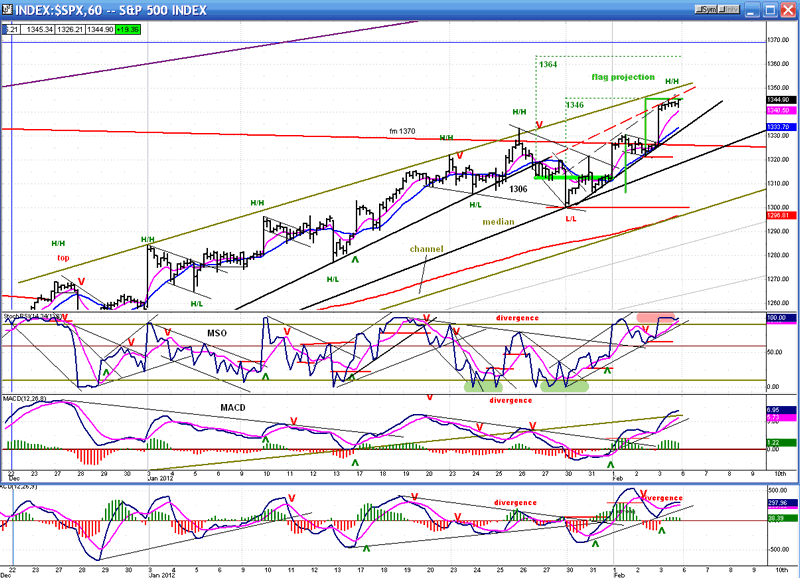
Let's now zoom in on the Hourly Chart (below).
When the SPX reversed from 1333, it made a new near-term L/L, suggesting that it has started a decline. But this was not confirmed by the action of the QQQ which remained well above its former low and then, by the SPX itself which was not able to follow through and immediately reversed its trend.
The subsequent move consisted of a "mast" with a "flag" forming at the top. On Friday, the normal price action following this kind of pattern occurred and the SPX nearly reached the flag projection of 1346. This is the same price target that was derived from the P&F re-accumulation pattern (heavy green line). With both projections coming together at that level, I would expect that a profit-taking pull-back will take place, followed by a short consolidation after which the index may attempt to reach the next target of 1364.
Already, the hourly indicators are telling us to expect a retracement. The MSO is overbought and just about ready to break its uptrend line, and the A/D oscillator is displaying some negative divergence.
But note that there is no divergence in the MACD, suggesting that we are probably not yet at the top of the move, and that a subsequent price extension to 1364 is a good possibility.
I think that it has been pretty well established that the QQQ tends to lead the SPX. Until now, it has outperformed the latter on all time frames. We should look for some signs of underperformance in the QQQ on a short-term basis as an additional sign that we have reached a short-term top. This could come at any time because the QQQ may already have reached its Point & Figure price projection for this move while the SPX probably has not.
Cycles
There has been a very dependable 10 trading day-cycle which last bottomed on 1/30 and which is due again on 2/13. That should be an important time marker because, depending on how much price weakness there is going into it, and how much strength coming out of it, we should be able to estimate if early March will be a low or a high.
The first week in March brings together a cluster of cycles which will probably mark a low.
Breadth
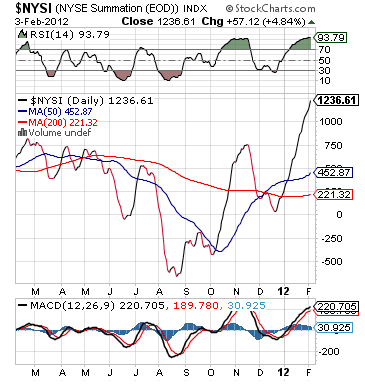
If you were not entirely convinced of the market strength, the Summation Index (courtesy of StockCharts.com) should help change your mind. It has continued to rise and is now in the vicinity of the 2009 high, which means that it is displaying the same strength that was being displayed in the early stages of the bull market. This is another reason not to expect a major top at any time soon.
The RSI is now thoroughly overbought and is beginning to flatten out. Its pattern is very similar to the one it made in late October-early November. The outcome should also be similar. Past history tells us that when this indicator is that much overbought, a short-term reversal in the stock market is not too far away.
Sentiment
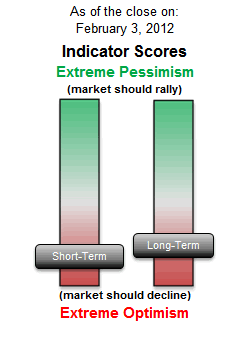
The SentimenTrader (courtesy of same) has actually had an imperceptible uptick in bullishness in its long-term indicator. This is not enough of a change to affect my market forecast.
On the other hand, the bearishness of the short-term suggests a potential pause at 1346, in line with expectations.
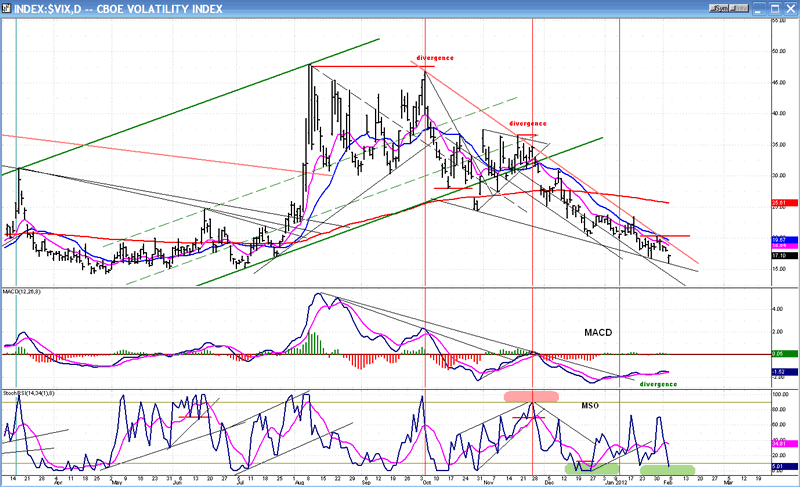
VIX:
The VIX (chart below) made a new low last Friday. By continuing its downtrend, the VIX confirms that there is no important top in sight for equity indices. Before one is formed, the VIX will have to create a base by bouncing along its low as it has done in the past.
Even when it breaks out of its intermediate trend line, this will not be a serious threat to equities, but only the beginning of the pattern required to eventually signal an important top in the market. Since the bull market low of 2009 -- and after having undergone a decline similar to the one it is experiencing today -- the VIX has gone through two phases of consolidation averaging about five months in length before it was able to re-establish a significant uptrend. The new low on Friday tells us that it has not even started its consolidation phase.
BONDS
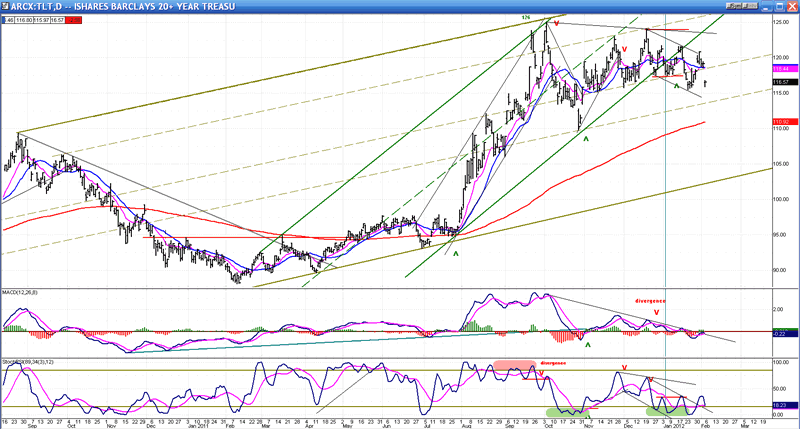
TLT (daily chart above) appears to be consolidating in a long-term uptrend. It broke out of an intermediate channel only a month ago, but it had been consolidating within that channel since its early October top. In other words, since the beginning of the current market uptrend. After reaching a high of 125 in the first month of its correction, it gave up 15 points before finding support at 110. This was followed by a rally which retraced nearly the entire decline. Since then, the index has been trading in a narrow range, remaining well above its correction low.
The nature of the consolidation suggests that TLT is still in a long-term uptrend and will eventually rise to new highs. A projection (to 137?) can be established after the current re-accumulation pattern has been completed - which is expected to be in the next week or two.
UUP (Dollar ETF)
Between May and September of last year, the US dollar (78.92) created a base pattern which, according to the P&F chart, suggests a move to about 90.
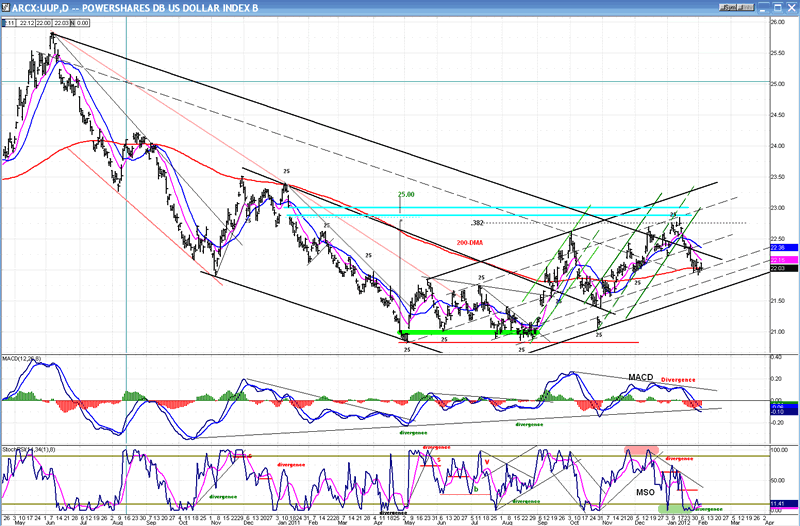
On the above chart of UUP (the dollar ETF) we can see that it has had difficulty getting out of a long-term downtrend, stopping its upward progress at only .382 of its long-term decline. However, it did manage to get out of its down channel for a while before pulling back into it but, more importantly, it is still in a pattern of higher highs and lows since it broke out of its base, and the present decline appears to be finding support on its 200-DMA. Also, the MSO is showing a trace of positive divergence and the MACD is just starting to curl up. These are signs that it may soon be in a position to resume its uptrend and break out of its channel decisively. This would be consistent with the anticipated short-term market top.
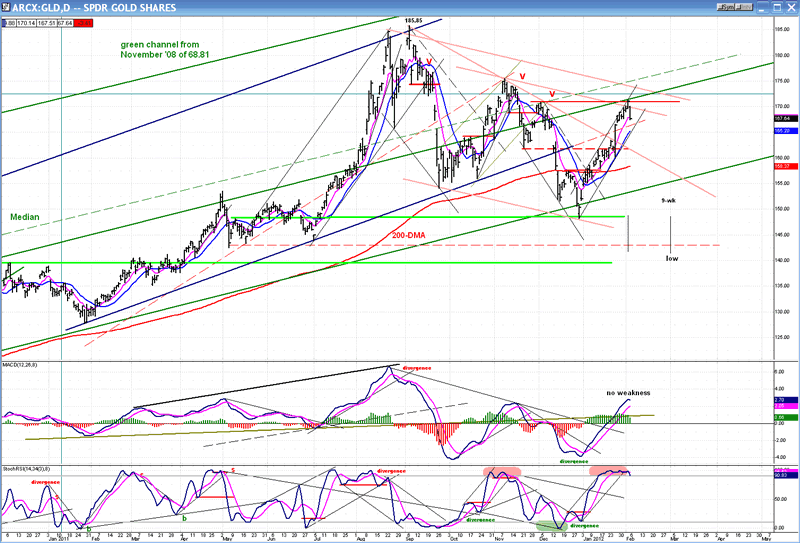
GLD (ETF for gold)
After meeting its intermediate projection of 186, GLD had a sharp correction of intermediate nature. The decline found support a few points above its ideal downside target of 143, and it started a rally which got a boost from the Fed's announcement that it intended to keep interest rates low for an extended period of time.
In total, GLD had a rally of 23 points which retraced .618 of its previous decline. The action of the last two days -- during which it shed about 3.5 points -- suggests that GLD may have found a short-term high at 171.23. While it has not yet given an outright sell signal, its daily indicators have started to roll over and, if it drops another 3 points (less if it does not do it right away), it will come out of its up-channel.
Most likely, there will be some topping activity in sync with the SPX top before much more weakness sets in. That would also coincide with a correction in the SPX, and a potential low in early March.
Summary
After making a very brief and shallow reversal from 1333, the SPX has formed a re-accumulation pattern which suggests a minimum move to 1346. This was essentially accomplished on Friday, and the index may now have a brief correction before attempting a move to the next P&F target of 1364. This is the level at which another short-term top is likely to form.
The longer-term indicators are not ready to signal an end to the bull market which started in March 2009, and perhaps not even (immediately) to the intermediate trend rally from 1075.
FREE TRIAL SUBSCRIPTON
If precision in market timing for all time frames is something which is important to you, you should consider a trial subscription to my service. It is free, and you will have four weeks to evaluate its worth.
For a FREE 4-week trial. Send an email to: ajg@cybertrails.com
For further subscription options, payment plans, and for important general information, I encourage you to visit my website at www.marketurningpoints.com. It contains summaries of my background, my investment and trading strategies and my unique method of intra-day communication with Market Turning Points subscribers.
By Andre Gratian
MarketTurningPoints.com
A market advisory service should be evaluated on the basis of its forecasting accuracy and cost. At $25.00 per month, this service is probably the best all-around value. Two areas of analysis that are unmatched anywhere else -- cycles (from 2.5-wk to 18-years and longer) and accurate, coordinated Point & Figure and Fibonacci projections -- are combined with other methodologies to bring you weekly reports and frequent daily updates.
“By the Law of Periodical Repetition, everything which has happened once must happen again, and again, and again -- and not capriciously, but at regular periods, and each thing in its own period, not another’s, and each obeying its own law … The same Nature which delights in periodical repetition in the sky is the Nature which orders the affairs of the earth. Let us not underrate the value of that hint.” -- Mark Twain
You may also want to visit the Market Turning Points website to familiarize yourself with my philosophy and strategy.www.marketurningpoints.com
Disclaimer - The above comments about the financial markets are based purely on what I consider to be sound technical analysis principles uncompromised by fundamental considerations. They represent my own opinion and are not meant to be construed as trading or investment advice, but are offered as an analytical point of view which might be of interest to those who follow stock market cycles and technical analysis.
Andre Gratian Archive |
© 2005-2022 http://www.MarketOracle.co.uk - The Market Oracle is a FREE Daily Financial Markets Analysis & Forecasting online publication.