


U.S. ISM Economic Data Cracks Beneath The Surface
Economics / US Economy Feb 05, 2012 - 07:06 AM GMTBy: Tony_Pallotta

 I was going to discuss the payroll report this week but the highly questionable report has been somewhat "discussed to death." What has not been discussed though is the ISM data for January.
ISM is broken into two components, services and manufacturing. Interesting that services represents a larger portion of the economy yet is given less emphasis. But that is neither here nor there. Both reports came in stronger than expected with services at a 10 month high while both continue to remain above the 50 level which defines expansion (above) and contraction (below).
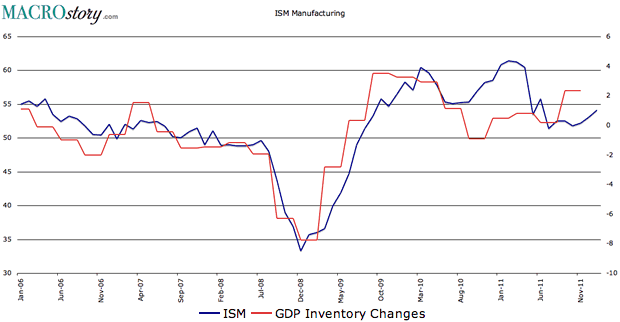
ISM Manufacturing
ISM manufacturing for January was 54.1 up from 53.1 in December. A good report even though global PMI (same as ISM) has been contracting. If you compare ISM though with GDP inventory changes you will see a very strong correlation which conceptually makes sense.
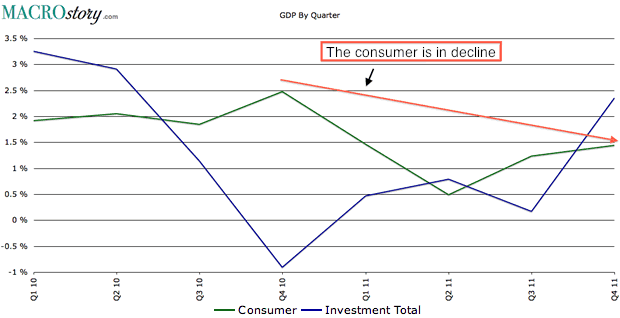
So far so good. The question I raise though pertains to inventory. In a recent post I discussed how inventory had expanded in Q4 2011 even though the consumer clearly is not. In fact the consumer savings rate fell to a multi-year low as the consumer is simply "tapped out." Which begs the question if the consumer is not expanding then how will inventory expand.
Which then begs one final question if inventory cannot expand how can ISM much longer? Answer, it cannot. It's all up to the consumer here.
ISM Services
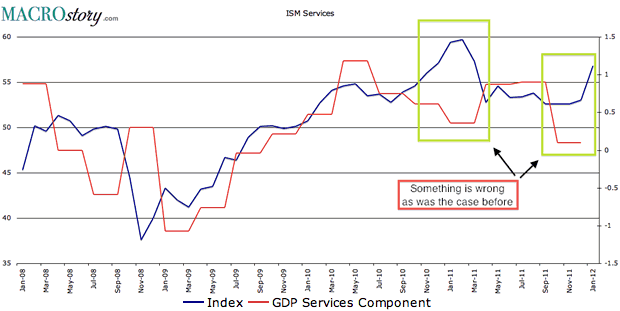
ISM services in January rose to 56.8 from 53.0. This report is a little easier to question by simply looking at ISM services VS The consumer services component of GDP. Again a rather conceptually obvious comparison. Notice how the services component of GDP in Q4 2011 moved sharply lower to 0.1 from 0.9. Contrast that with the increase in ISM services.
Clearly these two should not diverge. In fact they tried it once before as highlighted on the following chart and services was forced to revert to the mean rather quickly.
By Tony Pallotta
Bio: A Boston native, I now live in Denver, Colorado with my wife and two little girls. I trade for a living and primarily focus on options. I love selling theta and vega and taking the other side of a trade. I have a solid technical analysis background but much prefer the macro trade. Being able to combine both skills and an understanding of my "emotional capital" has helped me in my career.
© 2012 Copyright Tony Pallotta - Disclaimer: The above is a matter of opinion provided for general information purposes only and is not intended as investment advice. Information and analysis above are derived from sources and utilising methods believed to be reliable, but we cannot accept responsibility for any losses you may incur as a result of this analysis. Individuals should consult with their personal financial advisors.
© 2005-2022 http://www.MarketOracle.co.uk - The Market Oracle is a FREE Daily Financial Markets Analysis & Forecasting online publication.