


Market Trading Technical Indicators Love Hate Relationship
InvestorEducation / Learn to Trade Jan 27, 2012 - 12:08 PM GMTBy: EWI

 Trading using technical indicators -- such as the MACD, for example -- can do one of two things: help you or hurt you.
Elliott Wave International's Jeffrey Kennedy explains what he loves and hates about technical indicators and shows you how he uses them to his advantage in this excerpt from his FREE eBook, The Commodity Trader's Classroom.
I love a good love-hate relationship, and that's what I've got with technical indicators. Technical indicators are those fancy computerized studies that you frequently see at the bottom of price charts that are supposed to tell you what the market is going to do next (as if they really could). The most common studies include MACD, Stochastics, RSI, and ADX, just to name a few.
The No. 1 (and Only) Reason to Hate Technical Indicators I often hate technical studies because they divert my attention from what's most important - PRICE.
Have you ever been to a magic show? Isn't amazing how magicians pull rabbits out of hats and make all those things disappear? Of course, the "amazing" is only possible because you're looking at one hand when you should be watching the other. Magicians succeed at performing their tricks to the extent that they succeed at diverting your attention.
That's why I hate technical indicators; they divert my attention the same way magicians do. Nevertheless, I have found a way to live with them, and I do use them. Here's how: Rather than using technical indicators as a means to gauge momentum or pick tops and bottoms, I use them to identify potential trade setups.
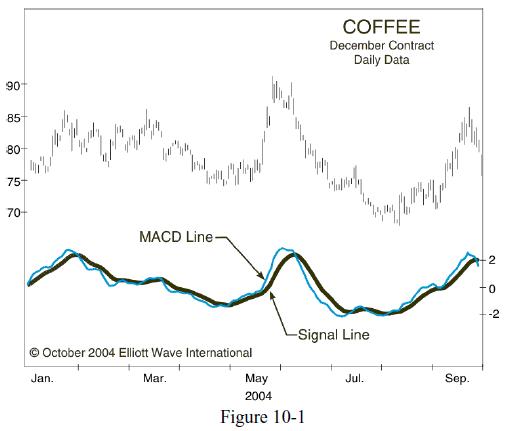
Three Reasons to Learn to Love Technical Indicators Out of the hundreds of technical indicators I have worked with over the years, my favorite study is MACD (an acronym for Moving Average Convergence-Divergence). MACD, which was developed by Gerald Appel, uses two exponential moving averages (12-period and 26-period). The difference between these two moving averages is the MACD line. The trigger or Signal line is a 9-period exponential moving average of the MACD line (usually seen as 12/26/9�so don't misinterpret it as a date). Even though the standard settings for MACD are 12/26/9, I like to use 12/25/9 (it's just me being different). An example for MACD is shown in Figure 10-1 (Coffee).
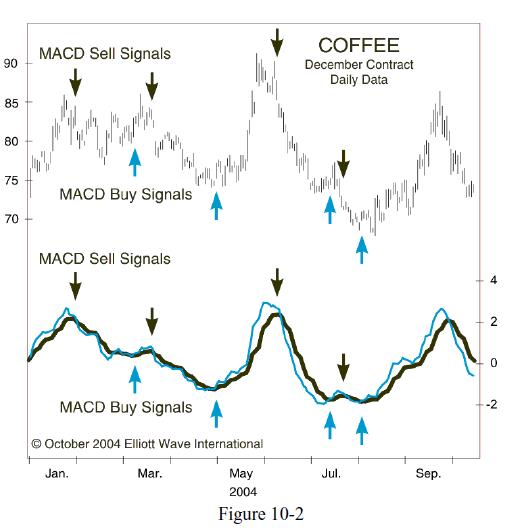
The simplest trading rule for MACD is to buy when the MACD line (the thin line) crosses above the Signal line (the thick line), and sell when the MACD line crosses below the Signal line. Some charting systems (like Genesis or CQG) may refer to the MACD line as MACD and the Signal line as MACDA. Figure 10-2 (Coffee) highlights the buy-and-sell signals generated from this very basic interpretation.
Although many people use MACD this way, I choose not to, primarily because MACD is a trend-following or momentum indicator. An indicator that follows trends in a sideways market (which some say is the state of markets 80% of the time) will get you killed. For that reason, I like to focus on different information that I've observed and named: Hooks, Slingshots and Zero-Line Reversals. Once I explain these, you'll understand why I've learned to love technical indicators.
|
Keep reading about Hooks, Slingshots, and Zero Line Reversals in The Commodity Trader's Classroom. This free eBook is filled with 32 pages of actionable trading lessons, such as:
Download your FREE Commodity Trader's Classroom eBook today! |

This article was syndicated by Elliott Wave International and was originally published under the headline Technical Indicators: A Love-Hate Relationship. EWI is the world's largest market forecasting firm. Its staff of full-time analysts led by Chartered Market Technician Robert Prechter provides 24-hour-a-day market analysis to institutional and private investors around the world.
About the Publisher, Elliott Wave International Founded in 1979 by Robert R. Prechter Jr., Elliott Wave International (EWI) is the world's largest market forecasting firm. Its staff of full-time analysts provides 24-hour-a-day market analysis to institutional and private around the world.
© 2005-2022 http://www.MarketOracle.co.uk - The Market Oracle is a FREE Daily Financial Markets Analysis & Forecasting online publication.