


What the Next Decade Holds for Commodities
Commodities / Commodities Trading Jan 17, 2012 - 11:39 AM GMTBy: Frank_Holmes

 What a decade! A rapidly urbanizing global population driven by tremendous growth in emerging markets has sent commodities on quite a run over the past 10 years. If you annualized the returns since 2002, you find that all 14 commodities are in positive territory.
A precious metal was the best performer but it's probably not the one you were thinking of. With an impressive 20 percent annualized return, silver is king of the commodity space over the past decade with gold (19 percent annualized) and copper (18 percent annualized) following closely behind.
Notably, all commodities except natural gas outperformed the S&P 500 Index 10-year annualized return of 2.92 percent.
Last year did not seem reflective of the decade-long clamor for commodities. In 2011, only four commodities we track increased: gold (10 percent), oil (8 percent), coal (nearly 6 percent), and corn (nearly 3 percent). The remaining listed on our popular Periodic Table of Commodity Returns fell, with losses ranging from nearly 10 percent for silver to 32 percent for natural gas.
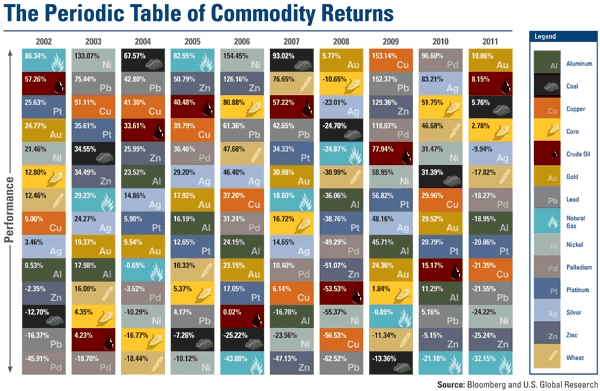
I think this chart is a "must-have" for investors and advisors because you can visually see how commodities have fluctuated from year to year. Take natural gas, for example, which posted outstanding increases in 2002 and 2005, but has been a cellar-dweller for the last four years as a result of overabundant supply and softening demand. The industry is also still trying to digest breakthrough technology that opened the door to vast shale deposits at a much lower cost.
On the other hand, oil finished in the top half of the commodity basket six out of the past 10 years. No stranger to volatile price swings, oil possesses much more attractive fundamentals as we continually see restricted supply coupled with rising demand.
After 11 consecutive years of gains, some are questioning whether gold can keep its winning streak alive in 2012. One of those skeptics is CNBC's "Street Signs" co-host Brian Sullivan. During my appearance on Thursday, I explained how I believe the Fear Trade and Love Trade will continue to fortify gold prices at historically high levels.
One reason the Fear Trade should persist in purchasing gold is the ever-rising government debt across numerous developed countries. During our Outlook 2012 webcast, John Mauldin kidded that the Mayans were not astrologers predicting the end of the world, but economists predicting the end of Europe. Whereas John believes the U.S. has wiggle room to decide on how to deal with deficits and debt, Europe and Japan are running out of time.
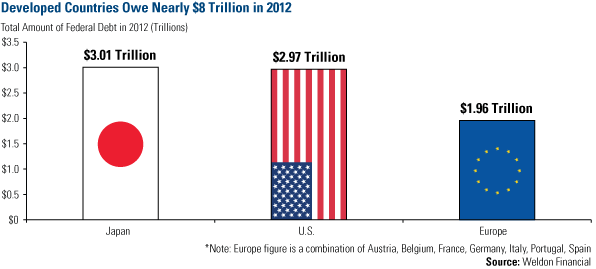
The situation is quite somber when you consider how much debt Europe, Japan and U.S. owes this year alone, says global macro research provider Greg Weldon. In his preview of 2012, Weldon says that the maturing principal and interest on U.S. Treasury debt due this year totals just under $3 trillion. Austria, Belgium, France, Germany, Italy, Portugal and Spain together face nearly $2 trillion in principal and interest payments. Japan, is the leader in the clubhouse, owing just over $3 trillion in 2012. With the combined debt for these developed countries totaling nearly $8 trillion, the interest payments alone dwarf the total GDP of many countries in the world.
Last week, Germany sold a 5-year government note for less than one percent, the lowest interest rate on record. Bids for the low-yielding debt were three times more than the amount sold, even as the consumer price index stands at more than two percent year-over-year. This means that investors have so few acceptable safe havens they are willing to accept negative real rates of returns.
This is good news for gold as a safe haven alternative against depreciating currencies such as the euro, the yen and the U.S. dollar.
The overwhelming debt burden in developed countries translates to an expected slowdown in imports from the emerging world. However, the grandest of those, China, likely won't be as affected as much as some people assume. This is "the biggest misconception" about the country's economy, says CLSA's Andy Rothman. Exports only play a supporting role for the Chinese economy. The world's second-largest economy is actually largely driven by domestic consumption from a population more than 1 billion strong with more padding in their wallets.
Andy says 10 years of tremendous income growth and little household debt, make China the "world's best consumption story, for everything from instant noodles to luxury cars" in 2012.
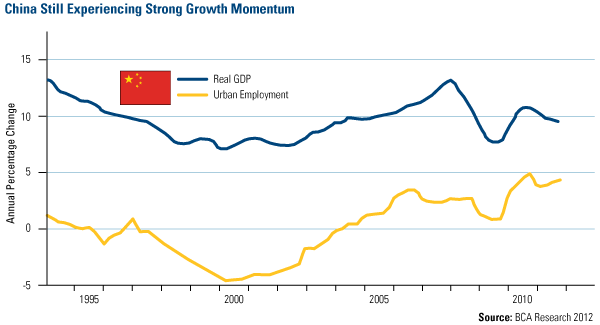
According to December Chinese trade figures, month-over-month and year-over-year imports of aluminum and copper increased significantly. This may be a result of China restocking ahead of Chinese New Year, but M2 money supply growth rapidly rose in recent months, a sign the government is attempting to reaccelerate the economy. Also, the urban labor market has been robust over the past two years, with an annual change just below 5 percent--a record high over the past 15 years.
Along with rising urban employment, income growth has been tremendous as well. CLSA says that last year was "the eleventh consecutive year of 7 percent-plus real urban income growth," with disposable incomes rising 152 percent over the past decade.
Investors shouldn't expect China's growth to be as robust as it's been, as the country's fixed asset investment growth drops below the 25 percent year-over-year pace of the last nine years, says CLSA. China's 12th Five-Year Plan has less infrastructure spending compared to the 11th Five-Year plan. Transport and rail spending is also expected to drop, with only water and environmental protection spending growth rising.
As shown in the BCA chart above, GDP growth has declined below 10 percent, but the growth is currently not the lowest we've seen in recent years. CLSA believes that China will prevent GDP growth from slipping below 8.5 percent for the full year, as "Beijing has the fiscal resources and political will to quickly implement a much larger stimulus."
Judging by the record number of articles mentioning a hard landing in China in late 2011, investor sentiment has swung from euphoria to excessive pessimism, according to BCA Research. Last fall, more than 1,000 articles discussed the risk of a "China Crash."
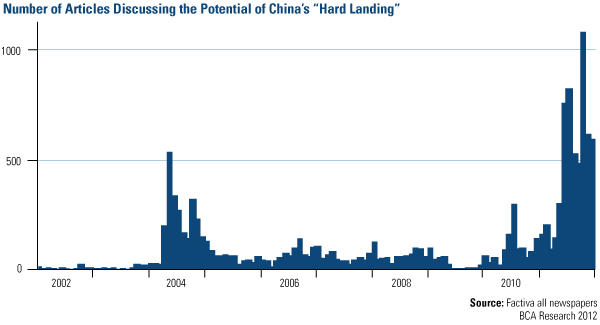
As I've mentioned before, contrarians view extremely bearish sentiment as a potential attractive entry point. BCA believes the pessimism has been priced in, as technical indicators as well as valuations for domestic and investable markets appear "deeply depressed."
What will happen over the next 10 years? I believe the supercycle of growth across emerging markets will continue with rising urbanization and income rates. This bodes well for commodities, especially copper, coal, oil and gold, and we'll continue to focus on companies that will benefit the most from these much-needed resources.
For more updates on global investing from Frank and the rest of the U.S. Global Investors team, follow us on Twitter at www.twitter.com/USFunds or like us on Facebook at www.facebook.com/USFunds. You can also watch exclusive videos on what our research overseas has turned up on our YouTube channel at www.youtube.com/USFunds.
By Frank Holmes
CEO and Chief Investment Officer
U.S. Global Investors
U.S. Global Investors, Inc. is an investment management firm specializing in gold, natural resources, emerging markets and global infrastructure opportunities around the world. The company, headquartered in San Antonio, Texas, manages 13 no-load mutual funds in the U.S. Global Investors fund family, as well as funds for international clients.
All opinions expressed and data provided are subject to change without notice. Some of these opinions may not be appropriate to every investor.
Standard deviation is a measure of the dispersion of a set of data from its mean. The more spread apart the data, the higher the deviation. Standard deviation is also known as historical volatility. All opinions expressed and data provided are subject to change without notice. Some of these opinions may not be appropriate to every investor. The S&P 500 Stock Index is a widely recognized capitalization-weighted index of 500 common stock prices in U.S. companies. The NYSE Arca Gold BUGS (Basket of Unhedged Gold Stocks) Index (HUI) is a modified equal dollar weighted index of companies involved in gold mining. The HUI Index was designed to provide significant exposure to near term movements in gold prices by including companies that do not hedge their gold production beyond 1.5 years. The MSCI Emerging Markets Index is a free float-adjusted market capitalization index that is designed to measure equity market performance in the global emerging markets. The U.S. Trade Weighted Dollar Index provides a general indication of the international value of the U.S. dollar.
Frank Holmes Archive |
© 2005-2022 http://www.MarketOracle.co.uk - The Market Oracle is a FREE Daily Financial Markets Analysis & Forecasting online publication.