


Gold Bull Bear Standoff Approaching Probable Bullish Resolution
Commodities / Gold and Silver 2012 Jan 16, 2012 - 11:41 AM GMTBy: Clive_Maund

 The current standoff in gold is approaching resolution and evidence is starting to pile up in favor of an upside breakout. We have been cautious on the PM sector for months starting with the September top which we shorted, resulting in massive profits in a matter of days, especially in silver, but there is always the danger of taking caution too far and getting caught on the wrong side of the trade.
Charts patterns allow for all possibilities and there remains the danger of a downside resolution, as we still have a Descending Triangle in gold and a potential Head-and-Shoulders top in silver, and the downside potential of these patterns would of course become reality in the event that the deflationary scenario prevails, which could be triggered by, say, a major bank failing in Europe, leading to an out-of-control run on the banks. That said, however, there is no denying that both the COTs and public opinion, particularly for the dollar and silver, are strongly bullish for the PM sector, and past experience shows that it usually a costly mistake to trade contrary to their indications.
It's time to make the call - to come down off the fence and take decisive, resolute action, and the great thing is that you (and I) can do this without fear of getting egg on our faces - why? - because of the highly favorable risk/reward ratio that now exists for the sector, as we will now demonstrate on the 2-year chart for gold.
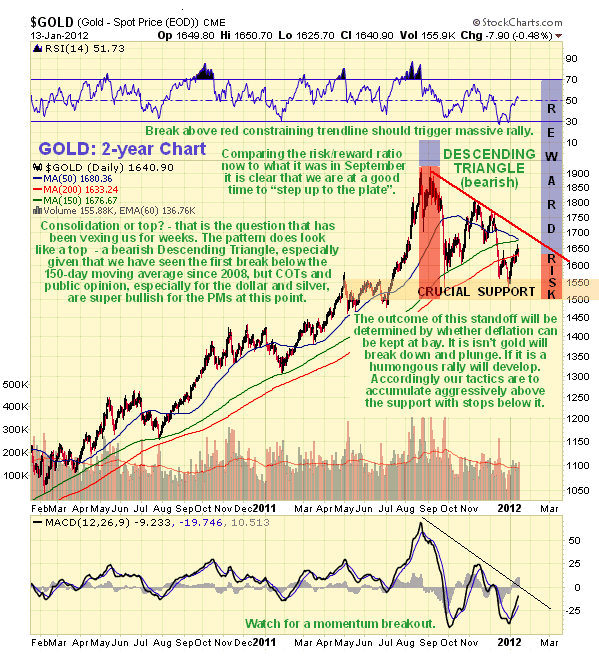
Remember when gold was racing ahead and making successive new highs back last August - September? It rose almost vertically to open up a huge gap with its moving averages as it became wildly overbought. This resulted in a highly unfavorable risk/reward ratio as shown on the chart, which was why we shorted it and especially silver aggressively, but now look at it! - the tables have turned and the risk/reward ratio has now swung back to being highly favorable as gold has become oversold and hunkered down beneath its moving averages. For sure the pattern that has formed is a Descending Triangle which is often bearish, especially as the price has dropped well below its 150-day moving average for the 1st time since 2008. We are aware of this which is why we have noted the positions of the exits, but we must set against this the strongly bullish COTs and public opinion. Fortunately for us, the fact that gold found support in December EXACTLY at its September lows establishes this level as obvious crucial support - if this support fails it's probably curtains for gold at least for a while as a deflationary bust would probably ensue, but if gold can hold above it for a little longer, the chances of a blistering rally will increase greatly, which will be triggered by a break above the red constraining trendline that marks the upper boundary of the Descending Triangle.
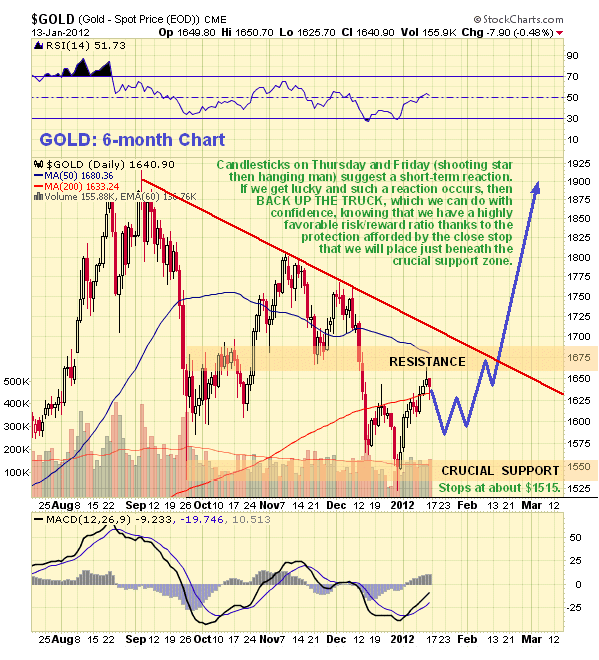
Even after the rally of the past 2 weeks, which can be seen more clearly on the 6-month chart below, the risk/reward profile is highly favorable, but should the price of gold drop back over the short-term towards the support again, the case for piling on the longs will be really compelling. This is because, in terms of the risk/reward ratio, it will be a "no brainer". We may see just such a minor reaction over the next week or two, for on Friday a "hanging man" candlestick appeared on the chart after the "shooting star" on Thursday which led us to take some profits off the table, and there is considerable resistance just above the current price near the falling 50-day moving average. Both these candlesticks are bearish, although they are rather small so we are only looking for a short-term reaction back towards the major support. If we do see such a reaction it will be time to "back up the truck" and we can do so without fear, confident that our stop, a little way below the support is unlikely to be triggered. (don't place the stop too close though, in case Big Money money engineers an intraday dip below the support to shake people out). An actual stop level is not given here in case Big Money gets to read this and decides to run us out of our positions for a bit of sport. In the less likely event that gold does not react back at all and instead powers through the red downtrend line you should grit your teeth and buy, placing a higher stop beneath the red line. On the site we closed out the Put side of a straddle trade on the approach to the big support at the end of December and went long the sector with a stop below the support, due to the compelling risk/reward ratio, and we will be buying more if we get the expected reaction in coming days.
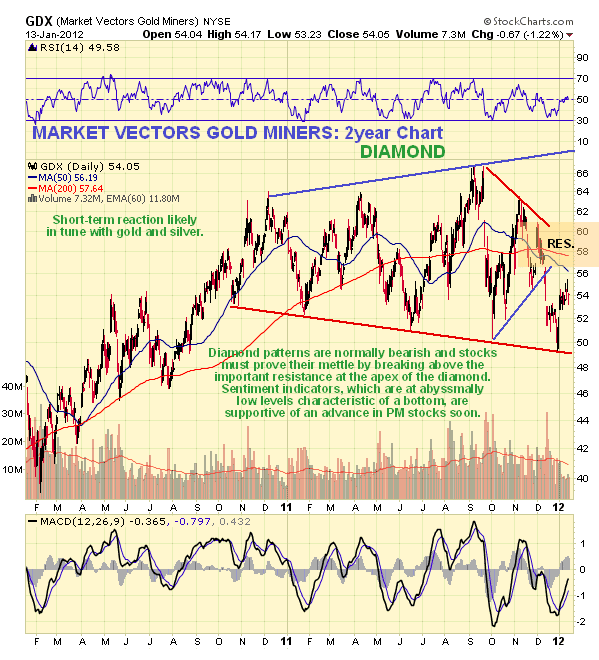
A big negative for PM stocks is that that they broke down in December from Diamond Tops, in the process establishing a zone of heavy resistance near to the apex or nose of the diamond, as we can see on the 4-year chart for the Market Vectors Gold Miners Index below. This resistance will need to be overcome to abort the bearish implications of the pattern, and traders may want to wait for that to occur before committing to stocks, and such waiting will not result in missing much in the way of the gains, as the really big upside action would follow on from the breakout above the apex resistance.
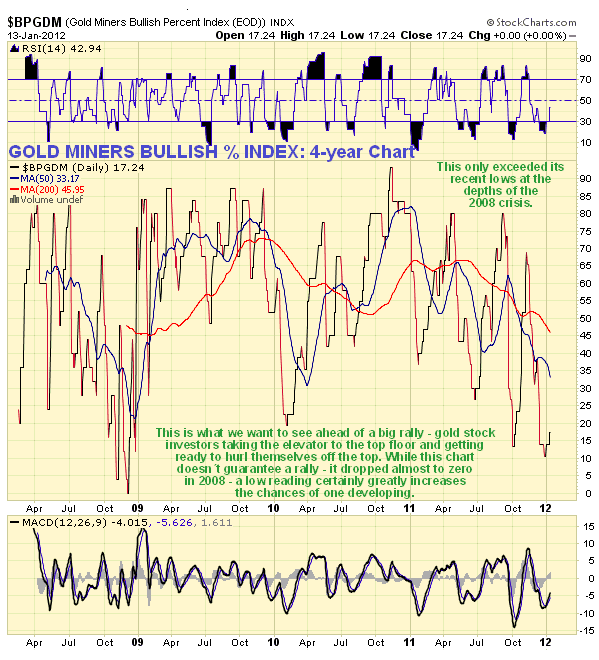
Unless we fall into a deflationary abyss this certainly looks like a good time to start accumulating PM stocks from the standpoint of sentiment, for as we can see on the Gold Miners Bullish Percent chart below, sentiment is at the abyssmally low levels that we would normally associate with a major bottom - this is the worst it has been since the depths of the 2008 selloff.
The notion bandied about in some quarters that gold is going to "disconnect from the dollar" is of course total nonsense - how can it disconnect from the currency that it is primarily priced in? It certainly hasn't disconnected from it in the past few months, as can be readily seen by comparing the charts for gold with the charts for the dollar from last September. The dollar has been powering ahead and gold has suffered accordingly - and silver has been slammed.
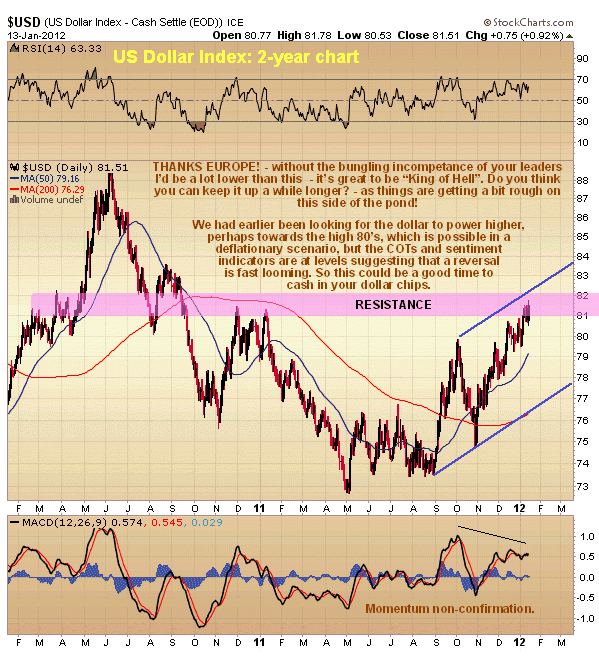
Having reminded ourselves that the course of the dollar is indeed important for the gold price outlook, let's now take a look at the dollar in an attempt to figure out what lies in store for it. Our assessment in the last update that the dollar index could storm ahead to the high 80's now looks too optimistic, after further consideration of the latest dollar COTs and sentiment indicators, and this is clearly good news for gold. It now looks more likely that the current dollar rally will peter out at the resistance zone and trendline resistance shown on our 2-year chart below, especially as upside momentum on this rally is considerably weaker than on the last one back in September, and it could end immediately. If this assessment is correct then it has only got a little further to run at best before it goes into reverse, and this "little further" fits with one last reaction back in gold and silver that should present a great buying opportunity.
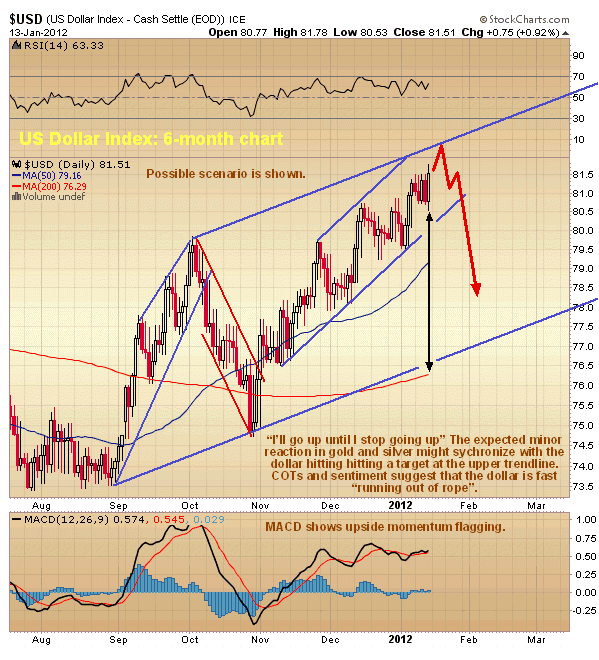
The 6-month chart shows the two intermediate uptrends and one downtrend thus far within the larger uptrend in the dollar. As we can see the current uptrend, which has opened up a large gap with the 200-day moving average, is getting "long in the tooth". It thus looks likely that the dollar will turn lower soon, probably after a final run at the parallel upper channel return line shown. The entire rally in the dollar from last August could be a 3-wave countertrend rally that is approaching completion.
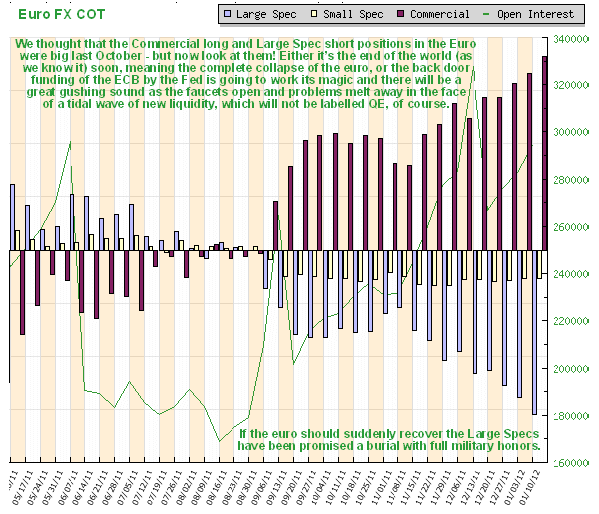
We thought that the Commercials had big long positions in the Euro back in October, but just look at them now! If the massive back door funding of the ECB by the Fed succeeds in doing the trick and enables the ECB to steady the ship by means of massive QE under another name (can't call it QE - the masses might recognise that), then the Large Specs are set to be "taken to the woodshed" for the hiding of their lives. This would also be great news for gold and silver, and for commodity prices generally.
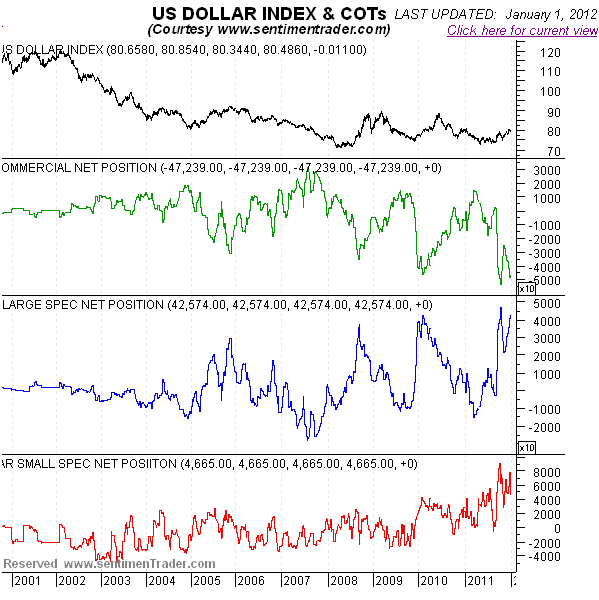
The extreme level of Commercial long positions in the Euro are of course mirrored by their extremely high short positions in the dollar, which are close to record levels. This is a big reason why the dollar rally is expected to fizzle soon.
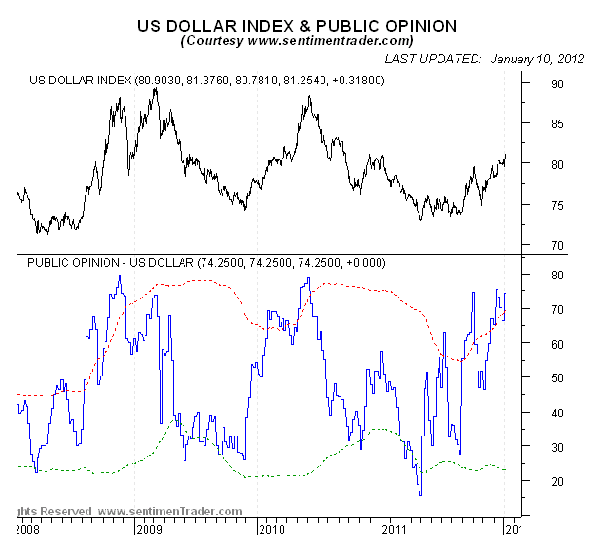
The public at large, who make it a point of honor to be always wrong, as a result of being clueless, are of course now strongly bullish on the dollar, see below, another warning.
In conclusion it now looks like a really big rally is incubating in gold and silver, and thus it is a good time to accumulate ahead of the breakout, and there is a chance that we will be presented with the ideal buying opportunity if we see a minor reaction over the next week or two, as looks likely. The risk/reward ratio is good, and will improve to excellent if we see such a minor reaction. If this assessment of the outlook is wrong and a deflationary downwave ensues soon, probably as a result of a bank failures in Europe and a possible run on the banks, then we will be closed out on stops for limited losses.
By Clive Maund
CliveMaund.com
For billing & subscription questions: subscriptions@clivemaund.com
© 2012 Clive Maund - The above represents the opinion and analysis of Mr. Maund, based on data available to him, at the time of writing. Mr. Maunds opinions are his own, and are not a recommendation or an offer to buy or sell securities. No responsibility can be accepted for losses that may result as a consequence of trading on the basis of this analysis.
Mr. Maund is an independent analyst who receives no compensation of any kind from any groups, individuals or corporations mentioned in his reports. As trading and investing in any financial markets may involve serious risk of loss, Mr. Maund recommends that you consult with a qualified investment advisor, one licensed by appropriate regulatory agencies in your legal jurisdiction and do your own due diligence and research when making any kind of a transaction with financial ramifications.
Clive Maund Archive |
© 2005-2022 http://www.MarketOracle.co.uk - The Market Oracle is a FREE Daily Financial Markets Analysis & Forecasting online publication.