


Anticipating the Stock Market Golden Cross
Stock-Markets / Stock Markets 2012 Jan 13, 2012 - 02:24 AM GMTBy: Frank_Holmes
 I had a neighbor who set his sprinkler system to go on every Wednesday around 5 a.m., about the same time I am about to reach his yard on my jog. After a few weeks of getting my ankles wet, I started to cross the street before I reached his property.
Like sprinkler systems, some traders have automatic triggers that initiate the buying or selling of blocks of stocks. One trigger where we generally see money move in and out of the market is based on the “golden cross,” which identifies when the 50-day short-term average crosses above the 200-day long-term average of a stock or index. You’ll find that many charts on Yahoo, Google, Bloomberg or other financial websites default to show this information along with the performance.
There’s a good historical reason traders use this mechanical trigger. Over the past 20 years, the 50-day line crossing above the 200-day average of the S&P 500 Index resulted in surprisingly bullish data. Of the nine times this event has occurred in those 20 years, the S&P 500 averaged a 23 percent increase before the market reversed.
One extraordinary example is the golden cross that occurred in September 1994, which resulted in a whopping 120 percent by the time the trend reversed in September 1998!
The lone exception to this trend was the unusual and very volatile market in 2010-2011. Even then, the S&P 500 only lost a third of a percent.
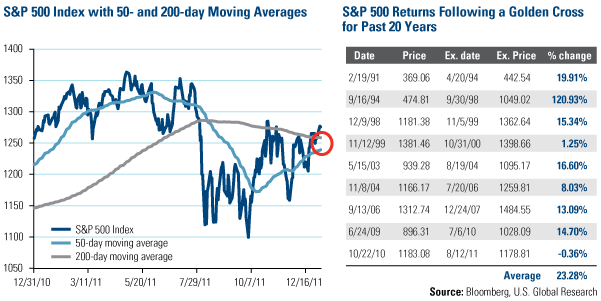
Today, the S&P 500 is only about one and a half percentage points away from the golden cross. With the index already above the 200-day moving average, the 50-day is on a path to continue rising. Perhaps this might encourage investors to “cross the street” now and anticipate the automatic trigger before traders act.
During our 2012 Outlook webcast, we discussed many market indicators to give you an idea of what to expect this year. If you missed the discussion, click here to listen to the webcast replay now.
The S&P 500 Index is a widely recognized capitalization-weighted index of 500 common stock prices in U.S. companies.
For more updates on global investing from Frank and the rest of the U.S. Global Investors team, follow us on Twitter at www.twitter.com/USFunds or like us on Facebook at www.facebook.com/USFunds. You can also watch exclusive videos on what our research overseas has turned up on our YouTube channel at www.youtube.com/USFunds.
By Frank Holmes
CEO and Chief Investment Officer
U.S. Global Investors
U.S. Global Investors, Inc. is an investment management firm specializing in gold, natural resources, emerging markets and global infrastructure opportunities around the world. The company, headquartered in San Antonio, Texas, manages 13 no-load mutual funds in the U.S. Global Investors fund family, as well as funds for international clients.
All opinions expressed and data provided are subject to change without notice. Some of these opinions may not be appropriate to every investor.
Standard deviation is a measure of the dispersion of a set of data from its mean. The more spread apart the data, the higher the deviation. Standard deviation is also known as historical volatility. All opinions expressed and data provided are subject to change without notice. Some of these opinions may not be appropriate to every investor. The S&P 500 Stock Index is a widely recognized capitalization-weighted index of 500 common stock prices in U.S. companies. The NYSE Arca Gold BUGS (Basket of Unhedged Gold Stocks) Index (HUI) is a modified equal dollar weighted index of companies involved in gold mining. The HUI Index was designed to provide significant exposure to near term movements in gold prices by including companies that do not hedge their gold production beyond 1.5 years. The MSCI Emerging Markets Index is a free float-adjusted market capitalization index that is designed to measure equity market performance in the global emerging markets. The U.S. Trade Weighted Dollar Index provides a general indication of the international value of the U.S. dollar.
Frank Holmes Archive |
© 2005-2022 http://www.MarketOracle.co.uk - The Market Oracle is a FREE Daily Financial Markets Analysis & Forecasting online publication.