


Gold Strongly Bearish Price Patterns and COT Confusion Cleared
Commodities / Gold and Silver 2012 Jan 08, 2012 - 01:31 PM GMTBy: Clive_Maund

 We have in recent weeks been rather confused by the contradiction between the strongly bearish price patterns that are developing in gold and silver, which are indicative of a major top that portends a brutal deflationary downwave, and the seemingly bullish COTs and sentiment for the sector. Now we believe that we have come to a realization with regards to what is going on with the COTs, which will be set out lower down the page - first we will look at the price pattern development.
Diehard bulls are now raving about the "great buying opportunity" that they see existing in gold right now, after its recent losses. This is reasonable and understandable as gold is now about $300 below its highs of last August - September, is oversold and in the vicinity of a still rising 200-day moving average, and COTs and sentiment are looking bullish. However, despite all this the price pattern that is forming in gold, and in silver, looks bearish in the extreme. As we can see on the 2-year chart for gold, a large bearish Descending Triangle has developed since it put in its highs, above a clear line of support at $1520 - $1530. Unless gold can abort the pattern by succeeding in breaking out above its descending upper boundary shown as the red trendline on the chart, then it is destined to break down, which will effectively mark the end of the bullmarket and this implies the onset, or rather the rather the rapid deepening, of the deflationary downwave that will then engulf many countries that have so far escaped its worst effects such as debt-wracked Britain and the US. If you want to know how bad it will get, you have simply to study what has already occurred in Greece and Spain - and it could get a lot worse than that with food shortages, riots, and cities going up in flames.
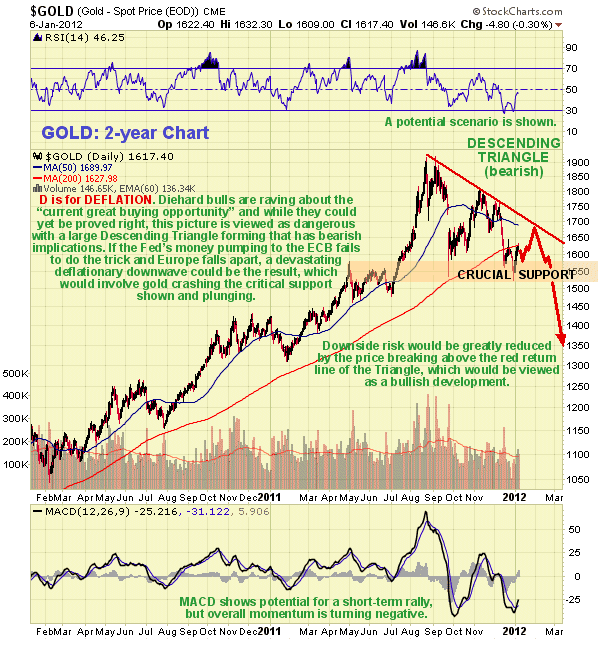
Let's stop here to consider the deflation-inflation argument briefly once again. The world needs - and sooner or later is going to get - a full fledged deflationary downwave, whose evolutionary purpose is to eliminate the massive debt and derivative mountains that are dragging the world economy into the mire. Of necessity this must involve the elimination of the parasitic entities that engineered the mess we are now in - the zombie banks and "too big to fail" corporations that have shoved their snouts deep into the trough of public funds via bailouts and other favors, such as extremely low interest rates. What has been going on since the crisis burst onto center stage in 2008 is that entrenched and powerful vested interests have been seeking to stave off the necessary deflationary purging by means of money pumping, playing around with the yield curve, and getting goverments and central banks to keep interest rates artificially low (for them) in order for them to continue their lives of power and privelege and to give them time to offload their bad debts onto to the taxpayer. However, time appears to be running out for them. Their latest ploy is back door funding from the Fed to the ECB in a desperate attempt to stop Europe collapsing - but the situation is now so bad in Europe that it is doubtful whether they will succeed. What looks set to happen is that bond holders will call their bluff with an avalanche of selling that drives interest rates through the roof - and this will eventually happen in the US - so that the whole bloated edifice comes crashing down in a hurry. This is what the ominous patterns in gold and silver portend. The obstruction of the necessary deflation and meddling by the powerful vested interests since 2008 has resulted in the deflationary forces continuing to gather strength with the result that the situation has become explosively dangerous.
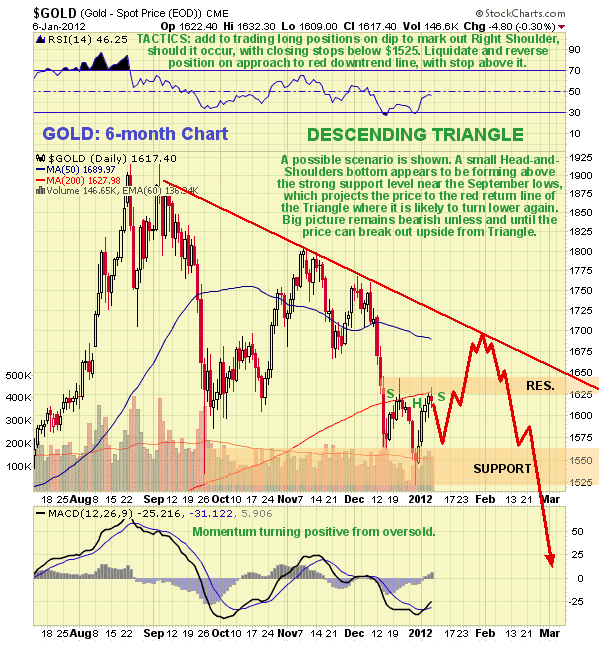
Near-term there is scope for a tradable rally in gold up to the red return line of its Decending Triangle, as we can see on its 6-month chart, and we bought the sector as it came off its lows about a week ago in anticipation of this, as it was a very low risk setup, because close stops could be placed just beneath the critical support level at the bottom of the Triangle. The chances of such a rally occurring are improved by the fact that a small Head-and-Shoulders bottom appears to be forming, as shown on the chart, and we will be looking to take modest profits on gold approaching the red downtrend line, should it get that far. Longer-term, however, a breakdown from the Triangle looks likely that would be expected to lead to a severe decline.
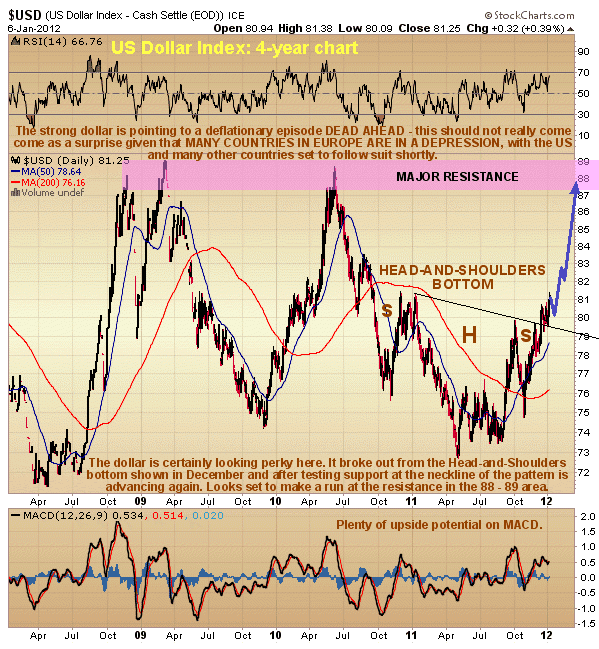
The dollar charts are certainly supportive of the notion that a deflationary downwave is set to hit soon, for as we can see on our 4-year chart for the dollar index, it has recently broken out of a large Head-and-Shoulders bottom and looks set to advance strongly soon towards an objective approaching resistance in the 87.50 - 89 area at the 2009 and 2010 highs, the first of which resulted from the panic into the dollar as a result of the 2008 financial crisis.
With regards to the realization concerning the seemingly bullish COTs for gold and especially silver, the following observations were made after Christmas on the site...
Up until now we have more or less automatically assumed that the Large Specs shown on the gold and silver COT charts were wrong and that if they were reducing their long positions to a relatively low level, it was bullish. This was a justifiable assumption that has worked for about 10 years in the Precious Metals markets, as whenever Large Spec long positions rose to a high level the PMs corrected, and when they dropped back to a relatively low level the PMs reversed to the upside to start a new uptrend, which is why we have taken to lampooning them mercilessly, calling them fools and suckers etc - but have the Large Specs really been wrong all these years? - after all they have been long throughout the gold and silver bullmarket. So it has to be said that overall they have not been wrong, but what they have been doing, within their overall correct long positioning, is becoming over-enthusiastic at intermediate market peaks and too negative or conservative at intermediate market bottoms. Despite being short throughout the gold and silver bull market, the Commercials have made money by milking the emotional extremes of behaviour of the Large (and Small) Specs at intermediate tops and bottoms.
In recent weeks, however, we have seen a sea change in the COT structure for gold and silver, with Large Spec long positions dropping back to a very low level in gold, and to an astoundingly low level in silver. Virtually everyone, ourselves included up to now, has taken this drop in Large Specs long positions to be strongly bullish, but looking at the COT charts we can see that this is not a normal drop, especially in silver. Bearing in mind that the Large Specs have been long throughout the bullmarket in Precious Metals, this massive unprecedented drawdown in their long positions, while at first glance looking strongly bullish, may well instead be due to their deciding that either the bullmarket in gold and silver is over, or at the very least that a brutal deflationary selloff is looming, as in 2008 and possibly worse, and this certainly fits with the bearish look of the price charts for gold and silver and Precious Metals at this time, all of which have suffered serious technical breakdowns in recent weeks, and this is said with the knowledge that there is some chance that the breakdowns may be the result of a planned campaign of "chart painting" by Big Money.
So far this realization that the Large Specs may be "draining" ahead of a major bearmarket episide in gold and silver is just a theory, but it certainly fits with the ominous price patterns in gold, silver and the PM stock indices, and also with the horrendous outlook for 2012, which promises to be the year when deflationary forces, held at bay for so long, and magnified by further increases in debt and derivatives, wreak havoc upon world markets and economies. This is the necessary nasty medicine that the world needs to rid itself of the debt and derivatives overhang and of the bloated parasitic entities such as the zombie banks and elite corporations that are dragging everyone and everything under.
There is another aspect affecting the gold and silver price that we need to take into consideration before closing, and that is the increasing chances of military action against Iran. The "Axis Powers", namely Great Britain, Israel and the US, have long sought hegemony over the Mid-East, for geopolitical reasons and to control the oil resources there, and have made great strides towards their long-term goals for the region in recent years. Here we should stop to point out that the term "axis" as used here is not condemnatory as used by George W Bush in his reference to an "Axis of evil", but merely refers to the congruent military and political alignments of the elites of these countries and their common goals. Countries in the Mid-East such as Saudi Arabia and the UAE are already "on board" as subservient client states of the Axis. Countries such as Afghanistan and Iraq, which were opposed to the Axis, have been invaded, neutered, and have had puppet governments installed. Remaining countries opposed to the Axis are being subverted and their governments toppled, examples being Libya, where the job has been completed and Syria where work remains to be done. That leaves one large ripe fruit waiting to fall into the Axis basket, and that is Iran, and this fruit needs to be prodded with a stick to get it to fall. The Axis considers that it has nothing to lose, and possibly plenty to gain by provoking conflict with Iran and is tightening the screw steadily by means of more stringent sanctions etc etc and time is of the essence as the Axis economies are verging on collapse due to excessive debt and so may not be able to maintain their massive military machine for much longer. If they can succeed in provoking Iran into doing something rash, like blocking the Straits of Hormuz, then they will have the perfect excuse to bomb Iran into submission, and will start by taking out all its military installations and nuclear facilities. The creation of an external enemy will immediately boost the flagging popularity of politicians at home, such as Barack Obama, who can then portray himself as the kind of "hard man" that American voters appreciate - and this is an election year. Furthermore, a lot of ordnance will be used up blasting Iran, which will be good news for the defence industry who will then have big new orders to replenish inventory. Once Iran and Syria fall, the Axis will effectively be in control of the entire Mid-East.
Incidentally, one of the jobs of Britain, as a primary member of the Axis and a grudging member of the European community, is to limit the power of Europe, which is why Britain regularly "puts a spanner in the works" by vetoing treaties etc as it did recently and prominently, although a factor in this may also be the "island mentality" of Britain. Senior readers may remember the hilarious headline in a British newspaper many years ago which read "Fog in the channel, Europe cut off", which sums up the attitude of Britain towards the rest of Europe. The attitude of the Axis elites towards China and Asians generally is also interesting. It became clear just weeks ago when they all but referred to China as an enemy and announced their intention to chummy up to Australia to create a military alliance to counter Chinese influence in the Pacific theatre. It would appear that China and Asians generally are not "members of the club" and beneath the pleasantries of diplomacy are regarded as aliens, in much the same way as you might regard the Klingons in Star Trek.
Needless to say, an attack on Iran could be expected to produce a sudden dramatic spike in the price of oil, and also gold and silver, although for obvious reasons the timing of such an attack is indeterminate - it could happen in 2 months or in 10. Such an attack will be made more likely of course by a deflationary downwave hitting, as in these conditions politicians will be looking for a distraction for the masses that gets them to "rally round the flag". So while the charts for gold and silver portend a severe decline, we should be mindful of the potential for a sudden spike at any time should conflict with Iran escalate.
In the event that we do not tip into the deflationary abyss soon as expected, probably the best commodity to invest in at this time is oil. This is because there is a supply restriction working through now that resulted from the drop in production due to the very low prices following the 2008 financial crisis, as made clear recently by renowned oil expert Dr Kent Moors. This is keeping the oil price propped up and could result in substantial gains provided the deflationary downwave doesn't hit first - and any such price gains would be magnified in the event of military action concerning Iran.
So we will be examining oil and oil related investments soon on the site.
By Clive Maund
CliveMaund.com
For billing & subscription questions: subscriptions@clivemaund.com
© 2012 Clive Maund - The above represents the opinion and analysis of Mr. Maund, based on data available to him, at the time of writing. Mr. Maunds opinions are his own, and are not a recommendation or an offer to buy or sell securities. No responsibility can be accepted for losses that may result as a consequence of trading on the basis of this analysis.
Mr. Maund is an independent analyst who receives no compensation of any kind from any groups, individuals or corporations mentioned in his reports. As trading and investing in any financial markets may involve serious risk of loss, Mr. Maund recommends that you consult with a qualified investment advisor, one licensed by appropriate regulatory agencies in your legal jurisdiction and do your own due diligence and research when making any kind of a transaction with financial ramifications.
Clive Maund Archive |
© 2005-2022 http://www.MarketOracle.co.uk - The Market Oracle is a FREE Daily Financial Markets Analysis & Forecasting online publication.