


World Stock Markets Year End Review: Good Riddance to 2011!
Stock-Markets / Stock Markets 2011 Jan 01, 2012 - 10:50 AM GMTBy: PhilStockWorld

 Courtesy of Doug Short. Our gang of eight world market indexes finished 2011 with a thinly traded, holiday-interrupted week that saw little drama. The average weekly performance of the eight was flat, with the CAC 40 taking the top spot for the second week in a row, and the BSE SENSEX at the bottom, equidistant below the flat line.
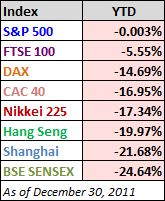 The Final Numbers for 2011
The adjacent table shows the final 2011 performance for our featured indexes. I said earlier that last week saw little drama. Actually there was a minor nail-biter over the question of whether the S&P 500 would finish the year with a gain or loss. The question wasn’t answered until the final trades were resolved at the market close. The 500 finished the year in the red by the three one-thousandths of a percent. I’ve added an extra decimal place in the table because at two decimal places, the finish rounds to zero.
The final tallies illustrate that, although the eurozone financial crisis has garnered all the attention in recent months, the Asia-Pacific was home to the year’s biggest losers. The SENSEX had the worst year, with a loss of nearly 25%. But the Shanghai Composite has fallen furthest from its interim high (see the inset in the line chart below). It is down a whopping 36.64% from its 2009 high, with the Nikkei, Hang Seng and SENSEX in a near dead heat for next to last, posting declines in the 25%-26% area.
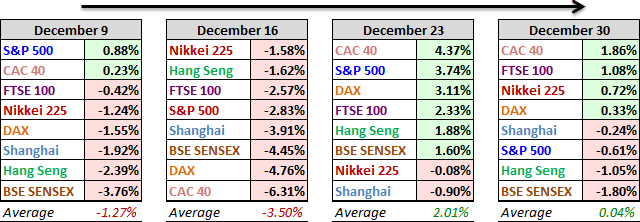
A Closer Look at the Last Four Weeks
The tables below provide a concise overview of performance comparisons over the past four weeks for these eight major indexes. I’ve also included the average for each week so that we can evaluate the performance of a specific index relative to the overall mean and better understand weekly volatility. The colors for each index name help us visualize the comparative performance over time.
The chart below illustrates the comparative performance of World Markets since March 9, 2009. The start date is arbitrary: The S&P 500, CAC 40 and BSE SENSEX hit their lows on March 9th, the Nikkei 225 on March 10th, the DAX on March 6th, the FTSE on March 3rd, the Shanghai Composite on November 4, 2008, and the Hang Seng even earlier on October 27, 2008. However, by aligning on the same day and measuring the percent change, we get a better sense of the relative performance than if we align the lows.

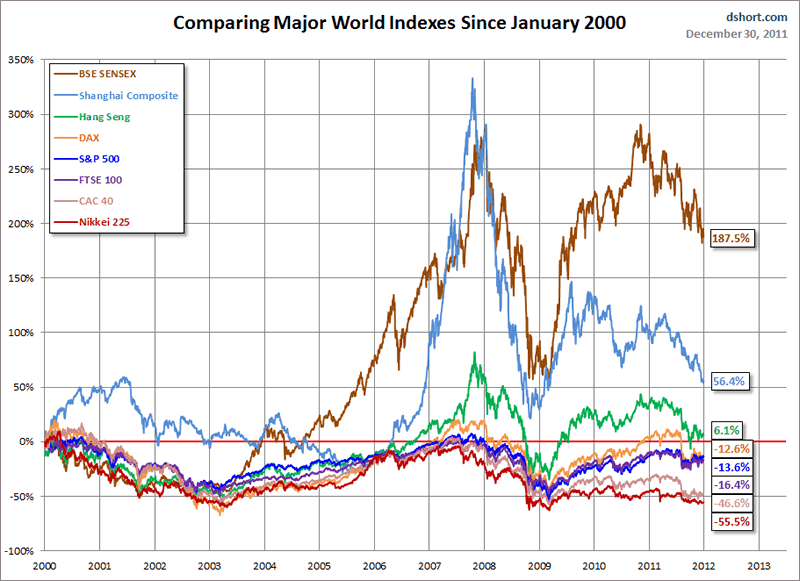
A Longer Look Back
Here is the same chart starting from the turn of 21st century. The relative over-performance of the emerging markets (Shanghai, Mumbai, Hang Seng) is readily apparent.
Check back next weekend for a new update
- Phil
Philip R. Davis is a founder of Phil's Stock World (www.philstockworld.com), a stock and options trading site that teaches the art of options trading to newcomers and devises advanced strategies for expert traders. Mr. Davis is a serial entrepreneur, having founded software company Accu-Title, a real estate title insurance software solution, and is also the President of the Delphi Consulting Corp., an M&A consulting firm that helps large and small companies obtain funding and close deals. He was also the founder of Accu-Search, a property data corporation that was sold to DataTrace in 2004 and Personality Plus, a precursor to eHarmony.com. Phil was a former editor of a UMass/Amherst humor magazine and it shows in his writing -- which is filled with colorful commentary along with very specific ideas on stock option purchases (Phil rarely holds actual stocks). Visit: Phil's Stock World (www.philstockworld.com)
© 2011 Copyright PhilStockWorld - All Rights Reserved Disclaimer: The above is a matter of opinion provided for general information purposes only and is not intended as investment advice. Information and analysis above are derived from sources and utilising methods believed to be reliable, but we cannot accept responsibility for any losses you may incur as a result of this analysis. Individuals should consult with their personal financial advisors.
© 2005-2022 http://www.MarketOracle.co.uk - The Market Oracle is a FREE Daily Financial Markets Analysis & Forecasting online publication.