


Gold and Silver 2012 Bullish and Bearish Arguments
Commodities / Gold and Silver 2012 Dec 23, 2011 - 12:55 AM GMTBy: Willem_Weytjens

 After the sharp drop in precious metals recently, many people (including me) wonder what will happen next with Gold & Silver (& other PM’s).
To be honest, I don’t know where gold will be in 1 week or a 1 month from now. However, there are some facts that are compelling, which can help us in our decision-taking process.
In this article, I will describe both the Bullish & Bearish arguments for Gold, Silver and PM Stocks.
Fundamentally, the outlook for precious metals has never been better: the crisis seems to be far from over, and a lot of money needs to be printed. This should bode well for precious metals.
Also, the fact that we haven’t had a “mania” fase in Precious Metals yet (perhaps we had some of it earlier this year with Silver) is also supportive for the PM sector.
Short term, sentiment in Gold is pretty bearish, as the charts from Sentimentrader show us: Sentiment is below the green dotted line.
Those charts use a relative measure of extreme, that being 1.5 standard deviations from a one-year moving average. So when Public Opinion moves above the red dotted line or below the green dotted line in the chart, it means that compared to other readings over the past year, we’re seeing a statistically extreme value.
However, back in 2008, Public Opinion on Gold was even more bearish, which should hold us back from concluding that we are at the bottom for Gold.
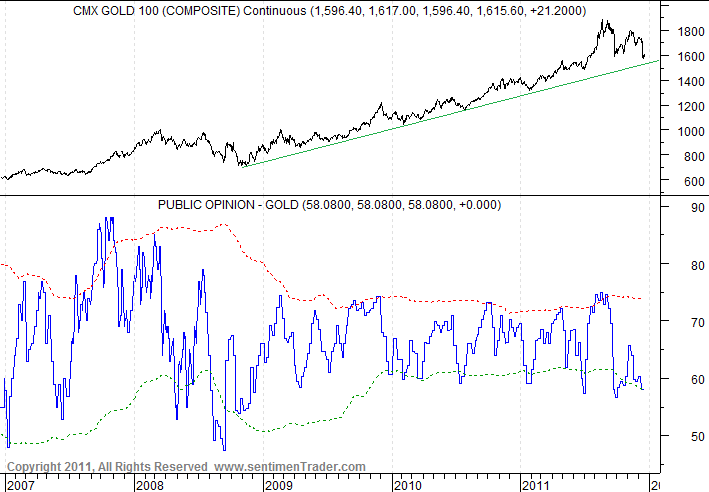
(Chart courtesy Sentimentrader)
Public Opinion for Silver however, is at extremely bearish levels and has been bearish for some time now. Back in 2008, a similar situation occured.
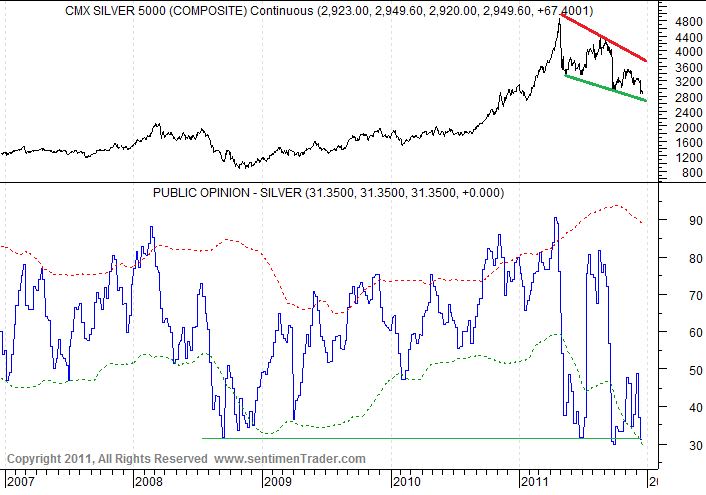
(Chart courtesy Sentimentrader)
However, the commodity sector is still very much influenced by the US Dollar. When people panic, they tend to rush into the US Dollar, as they perceive it to be a “safe” currency as it is very liquid. The following chart from Sentimentrader shows us that Public Opinion about the US Dollar is extremely Bullish, meaning a top in the US Dollar could be within a hand’s reach. Whenever Public Opinion was this bullish over the last 5 years, the US Dollar was close to – or in the process of – setting a top.
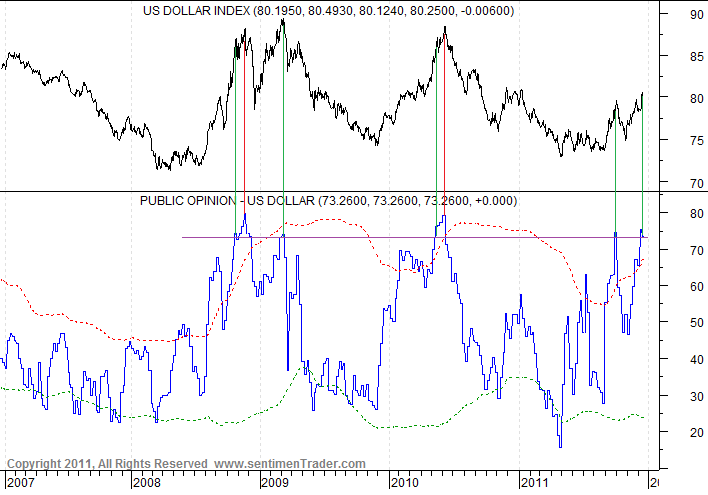
(Chart courtesy Sentimentrader)
A lot of this “US Dollar Strength” is due to the weakness in the European currency. Please notice that Public Opinion for the Euro is at extreme Bearish levels, indicating that the Euro could be close to or in the process of setting a bottom, which would be bullish for precious metals (and stock markets).
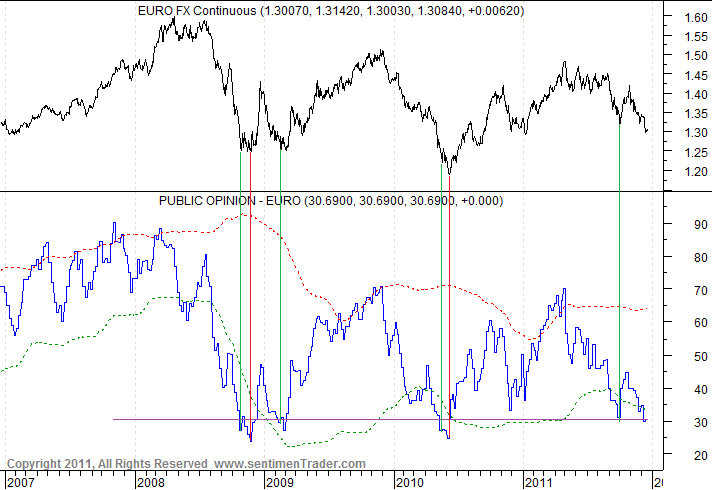
(Chart courtesy Sentimentrader)
When we look at the weekly chart of the Gold Price during this bull market, we can see that price ALWAYS found support at the 50EMA (50 weeks Exponential Moving Average), except for 2008 when Deflation was the bogeyman. I marked all those events on the price chart, but also on the indicator on the bottom of the chart, which shows us the % difference between price and the 50 weeks EMA. Right now, price is very close to this 50EMA, meaning Gold might be in the process of bottoming.
(Chart: Prorealtime)
Historically, the Bullish % index for Precious Metals stocks has been a good indicator. Currently, it stands at only 13.79, which is a very depressed level. The only times it reached these bearish levels was back in 2008 and recently in early October.
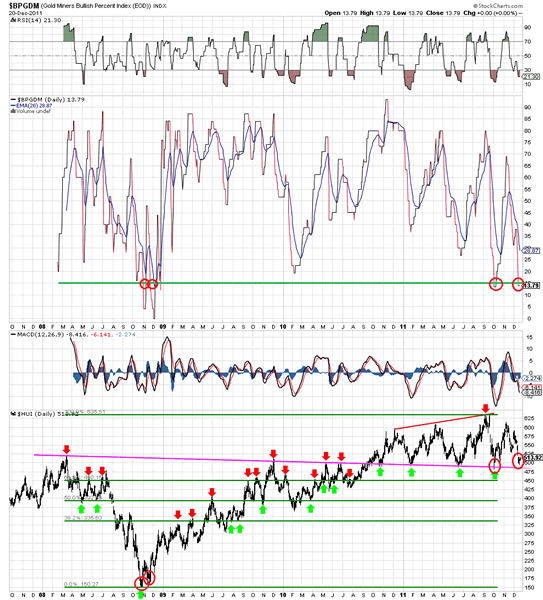
(Chart courtesy stockcharts.com)
The factors above tell us Gold (and especially Silver) might be in the process of setting a bottom.
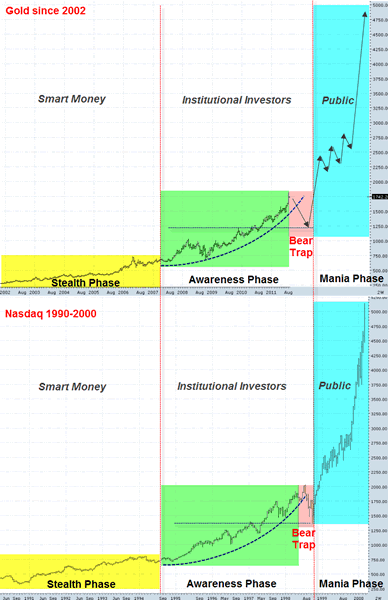
When we compare the Bull Market in Gold with the Technology Bubble in the 1990′s, we can see that Gold is still far away from topping…
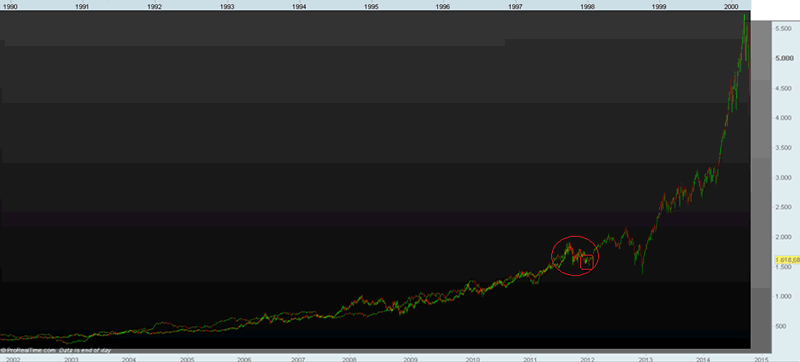
(Chart: Prorealtime)
Serge from ETF-Corner made a similar analysis a couple of months ago, which shows us gold could even drop as low as $1,250 without doing any harm to the bull market:
Let’s now have a look at the latest COT (Commitment of Traders) chart.
Commercials are still holding low Net Short positions. This should be a bullish sign for Silver.
However, we can see that in the past they have held even smaller Net Short Positions:
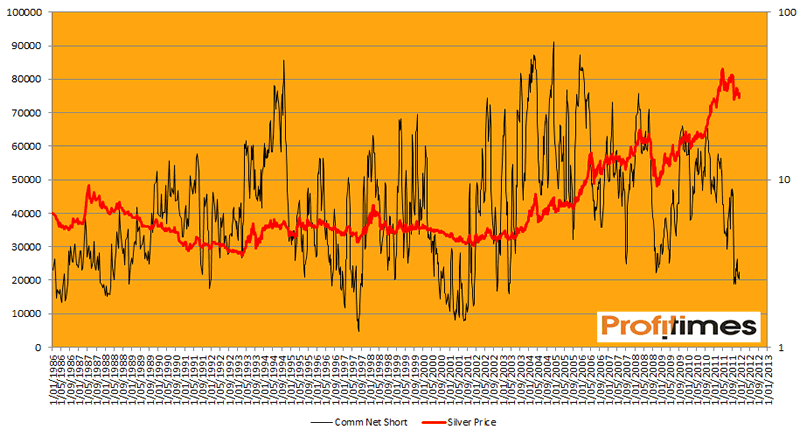
Commercials are considered to be “Smart Money”, while NonCommercials are considered to be “Dumb Money”.
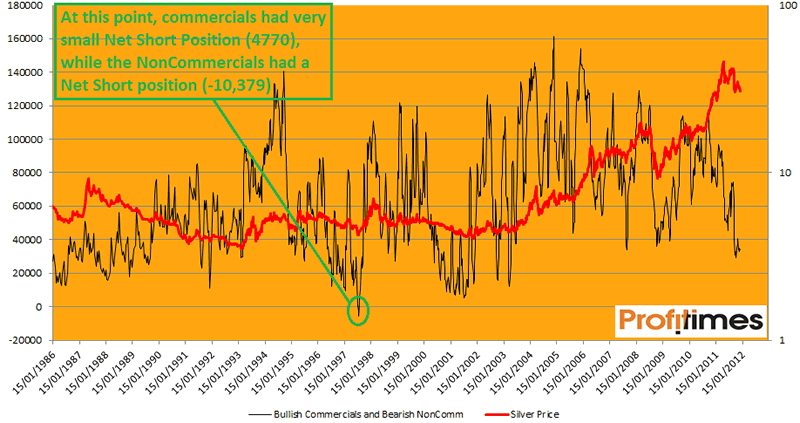
If we combine both, we get a good view of the general market. Bullish Commercials (=low Net Short Positions) combined with Bearish NonCommercials (=low Net Long Position or even Net Short Positions) would be a very Bullish sign, as the Smart Money would be set for a rise in prices and Dumb Money would be expecting a drop in prices.
Currently this “indicator” is pretty low, although it went even NEGATIVE in 1997. This was because in 2007, Commercials held a low Net short position, while NonCommercials held Net SHORT positions (which doesn’t happen often). Right now, we are still pretty far away from that situation.
What followed was an amazing run up in Silver prices, as Silver rose more than 80% over the next 6 to 7 months:
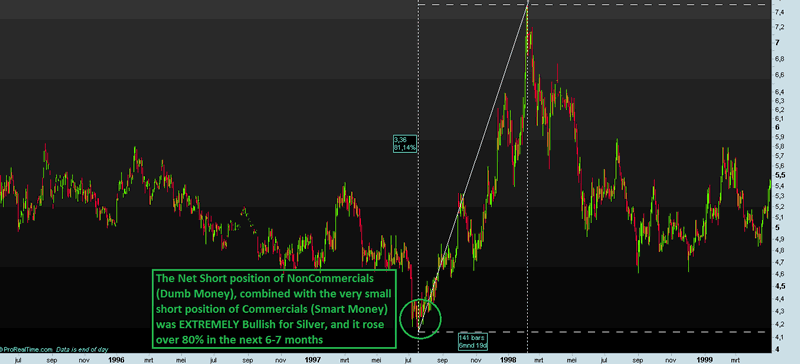
(Chart: Prorealtime)
In what follows next, I will show some worriesome charts.
Silver dropped below support at $30 and still has not managed to close back above it. Below current prices there is little support on the way down to the high teens (18-19$).
We are still far away from a buy signal on both the RSI and MACD.
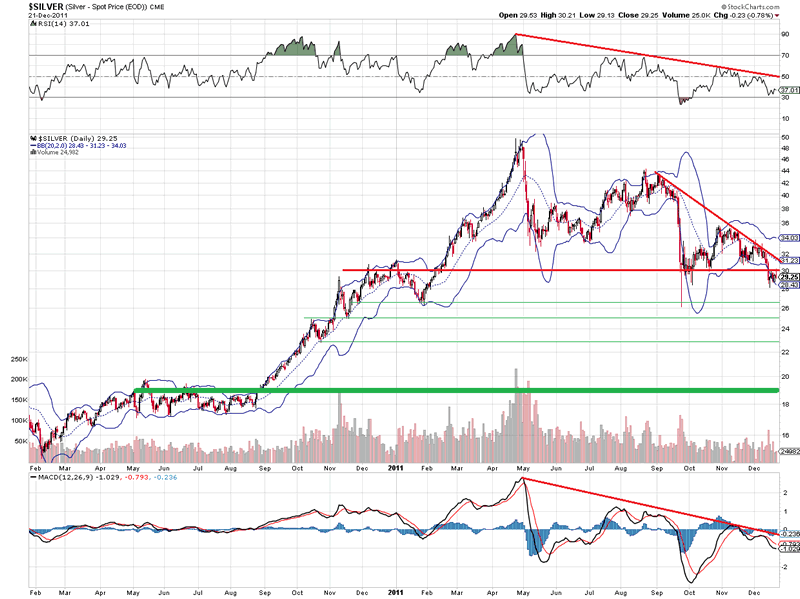
(Chart courtesy stockcharts.com)
Gold could be in an ABC down wave, which could take it as low as $1,400.
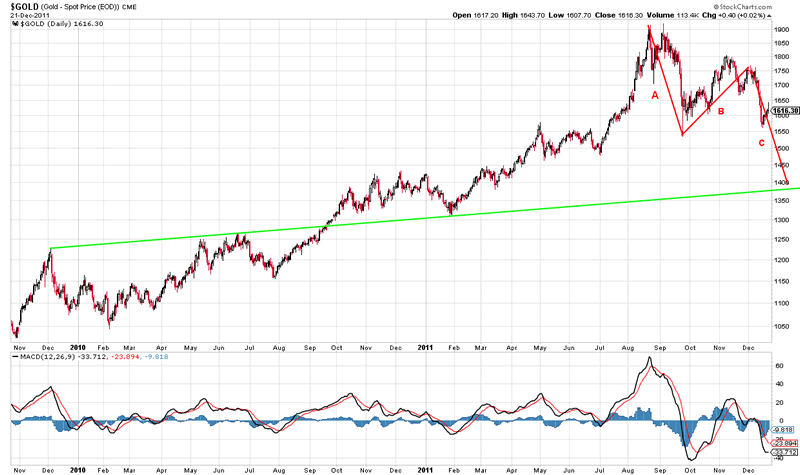
(Chart courtesy stockcharts.com)
Back in April 2011, when silver was close to hitting my target of $48, I shared the following Quarterly Silver chart with my readers:
(Chart: Prorealtime)
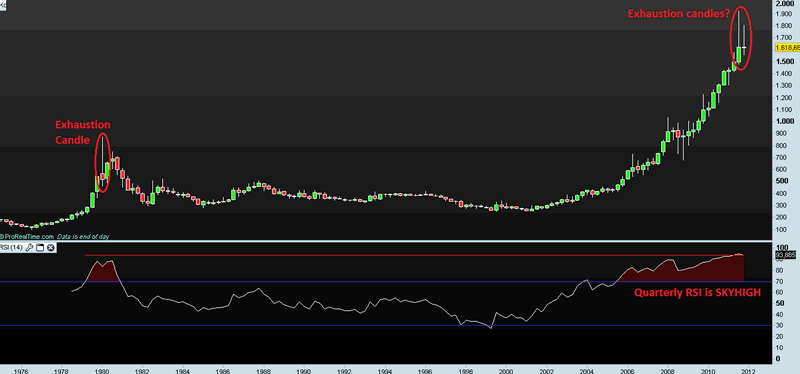
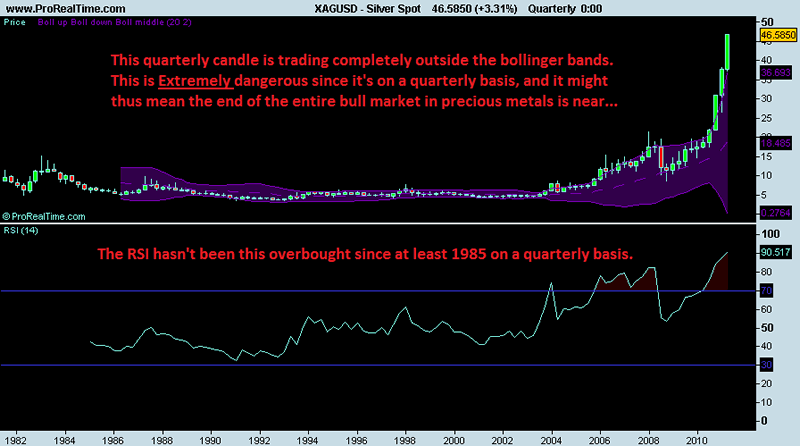
We all know what happened afterwards. Perhaps it’s time to get worried about the Quarterly Gold chart:
We now have 2 possible Exhaustion Candles, and Quarterly RSI is EXTREMELY overbought, which is unsustainable.
(Chart: Prorealtime)
A larger correction is needed for RSI to cool down. Perhaps Deflation will show up again in 2012?
Take a look at the following chart which compares the SP500 (currently) to the SP500 in 2008.
The similarities are striking.
IF (and yes, that’s a big IF), the pattern holds, we would expect the SP500 to be catching its last breath right now before plunging in 2012.
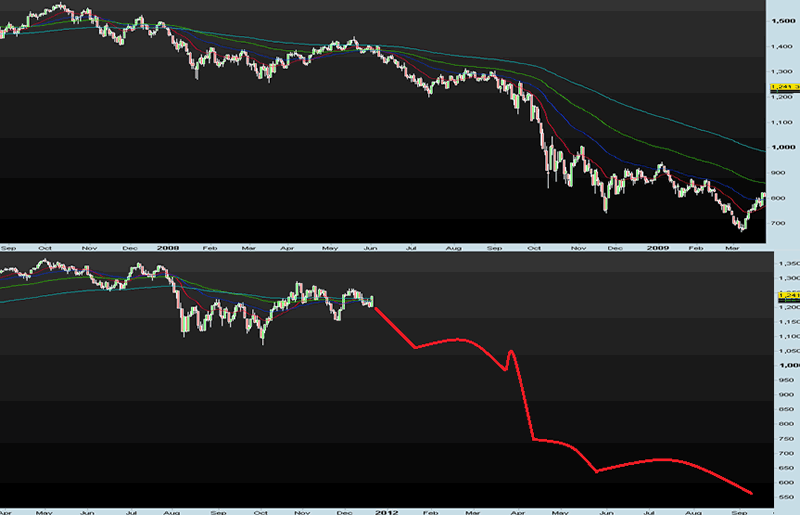
(Chart: Prorealtime)
I’m not saying it will, but if it does, what should we expect from Mining Companies?
Just like in 2008, they would most likely sell off, even more than physical gold, which can be seen in the HUI/GOLD ratio.
Notice that the HUI/GOLD ratio is showing the same pattern now as in 2008 (a bearish flag), and that the MACD is about to break out of a flag pattern. If it breaks to the downside, watch out…
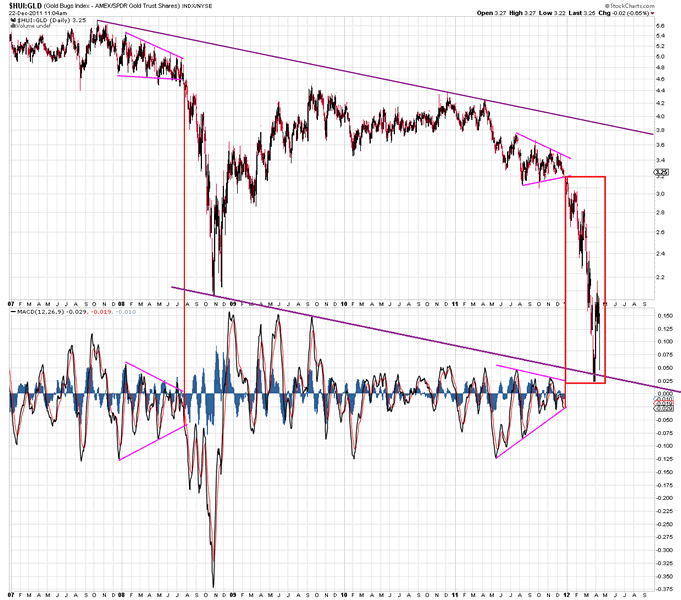
(Chart courtesy stockcharts.com)
Based on the analysis above, I would conclude that Precious Metals are in the process of bottoming right now.
However, if the bottom falls out, look out below, as we could then be headed for a 2008-like CRASH.
I wish everybody a Merry Christmas, and a Prosperous, Healthy and Happy New Year!
If you would like to read more Analyses, receive Trading Updates (we invest REAL CAPITAL) and get access to Nightly Reports, feel free to consider signing up for our services at www.profitimes.com
Willem Weytjens
www.profitimes.com
© 2011 Copyright Willem Weytjens - All Rights Reserved
Disclaimer: The above is a matter of opinion provided for general information purposes only and is not intended as investment advice. Information and analysis above are derived from sources and utilising methods believed to be reliable, but we cannot accept responsibility for any losses you may incur as a result of this analysis. Individuals should consult with their personal financial advisors.
© 2005-2022 http://www.MarketOracle.co.uk - The Market Oracle is a FREE Daily Financial Markets Analysis & Forecasting online publication.