


Stock Market Santa Rally May Now Be Over
Stock-Markets / Financial Markets 2011 Dec 10, 2011 - 02:35 PM GMT

 -- The VIX revisited mid-cycle support at 26.38 on a pullback from intermediate-term trend support/resistance at 30.55. However, longer-term the VIX closed below its weekly and monthly support (red line). It appears that the diamond formation that I had been pointing out the last two months has had a false breakout. The cycles, however, point to a higher year-end for the VIX. Despite closing below intermediate-term trend support, the VIX shows a reversal pattern that suggests a breakout next week..
The NDX is caught between support and resistance…
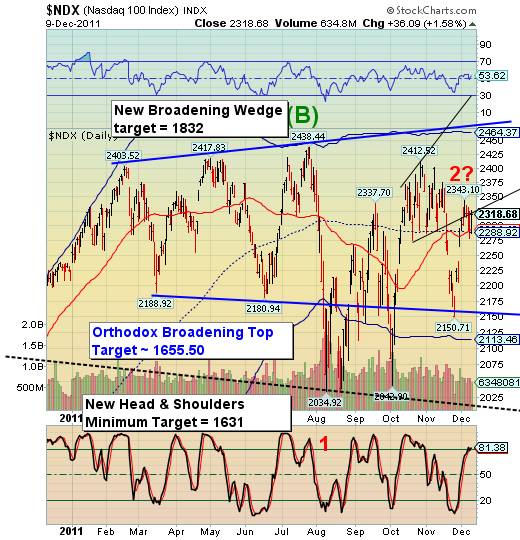
-- The /NDX declined to daily half-cycle support at 2288.92 and 200-day moving average at 2291.26, then rallied back up to Broadening Wedge trendline resistance at 2320.00. However, the bounce is not showing the strength as it did just after the Thanksgiving holiday. The wave structure in the bounce suggests a Fibonacci 86.8% retracement may be complete.
Today's high may also mark the retest of the sell signal generated by the violation of the Broadening Top lower trendline If so, a reversal down below mid-cycle and 200-day supports leaves the NDX bereft of supports until it meets the lower trendline of the Orthodox Broadening Top. The potential for a Flash Crash at that point is extremely elevated.
… Ditto the SPX.
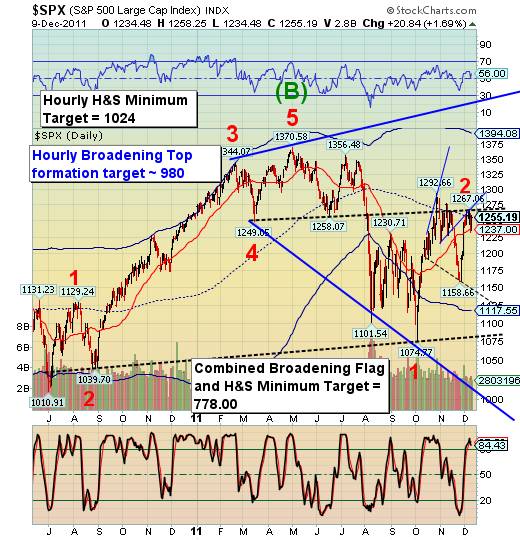
-- The SPX is also caught between intermediate-term trends or at 1237.00 and midcycle resistance at 1255.81. It already has been given a sell signal as a reverse on the conjunction of two broadening formations at 1267.06. This implies immediate targets of 980.00 to 1024.00 and a potential breakthrough of a much larger Head and Shoulders pattern. The combined targets of these two larger formations appears to be 778.00. Although these patterns are not yet confirmed, the implications of their potential are enormous. Wave 3 may be nearly twice the size of wave 1.
The Euro approaches its neckline.
-- The Euro has been gingerly approaching its Head and Shoulders neckline, near 132.40, for the past week. It now appears ready to break its neckline and take a plunge towards parity with the dollar. While it is possible that the euro in the complete a final retracement bounce to 136.04, the likelihood appears to be dimming. Since early May the euro has had an increasing correlation with the Standard & Poor's 500 index. There is a strong implication that as the Euro Zone crumbles, so will the financial markets in the United States as well.
The US Dollar may be ready to break out.
-- The dollar has gone virtually nowhere in the past week as it consolidated its gains above its Broadening Formation trendline. In the consolidation it has challenged its cycle top resistance at 79.15 multiple times. The breakout of its inverted Head and Shoulders pattern appears inevitable. The Broadening Bottom formation is now confirmed with a very high 98% probability of success in meeting at least a portion of its target. (Source: Encyclopedia of Chart Patterns, by Thomas N. Bulkowski, page 12) The Broadening Bottom minimum gain nicely matches the minimum target for the inverted Head and Shoulders pattern.
Gold shows weakness.
-- Gold appears to have completed the right shoulder of its Head and Shoulders pattern this week. Gold made its cycle turn last Friday which may cause gold to violate its neckline as early as Monday, setting up a minimum decline to its Orthodox broadening top lower trendline at 1525.00.
The new trading cycle calls for a significant low in gold by the end of December.
U.S. Bonds remain in positive territory.
-- This week USB continues to bounce off intermediate-term trend support at 141.04. Treasury bonds remain on a buy signal and appear oversold enough for a strong reversal. Treasury bonds made their one half trading cycle low on December 1, implying strength into the end of the year for USB.
Oil bounces from trendline support.
--West Texas Crude bounced from the lower trendline of its Broadening Wedge formation at 97.50 on Friday. The expected trading cycle high was made on the prior Friday, suggesting weakness through the year end. In violation of the trendline implies a strong decline that may violate prior lows by year end.
For the most part, West Texas crude appears to be correlated with our domestic equities. That suggests that oil may be linked with stocks in a decline lasting possibly three or more weeks, at a minimum. It also appears that oil may be starting a crash pattern in conjunction with our domestic equities.
China stocks violated the October lows.
In a sober I drew a "line in the sand" for the Shanghai Index. If the index retested, but did not go below the 2307.15 low from the end of October, it would have introduced a brand-new bottle market in Cheney stocks. I suggested monitoring the behavior of the Shanghai index while U.S. equities are in full decline to see if that low would hold. It did not.
This suggests that the Chinese bear market is not yet over. However, its cycle pattern appears stronger than that of US or European stocks. The next Master Cycle low may appear in the first quarter of 2012. Again, I will be monitoring the Shanghai index for strength that may not appear in our domestic markets.
The banking index rallies in a truncated fractal.
The BKX retested its intermediate-term trend support/resistance at 38.35 but remains positive into the weekend. However, the cycle model suggested a Trading Cycle top on December 7, which appears to have happened. A decline below trend support would signal the resumption of the bear market and the potential violation of the massive head and shoulders neckline at 32.56
Good Luck and good trading!
Tony
Our Investment Advisor Registration is on the Web
We are in the process of updating our website at www.thepracticalinvestor.com to have more information on our services. Log on and click on Advisor Registration to get more details.
If you are a client or wish to become one, please make an appointment to discuss our investment strategies by calling Connie or Tony at (517) 699-1554, ext 10 or 11. Or e-mail us at tpi@thepracticalinvestor.com .
Anthony M. Cherniawski, President and CIO http://www.thepracticalinvestor.com
As a State Registered Investment Advisor, The Practical Investor (TPI) manages private client investment portfolios using a proprietary investment strategy created by Chief Investment Officer Tony Cherniawski. Throughout 2000-01, when many investors felt the pain of double digit market losses, TPI successfully navigated the choppy investment waters, creating a profit for our private investment clients. With a focus on preserving assets and capitalizing on opportunities, TPI clients benefited greatly from the TPI strategies, allowing them to stay on track with their life goals
Disclaimer: The content in this article is written for educational and informational purposes only. There is no offer or recommendation to buy or sell any security and no information contained here should be interpreted or construed as investment advice. Do you own due diligence as the information in this article is the opinion of Anthony M. Cherniawski and subject to change without notice.
Anthony M. Cherniawski Archive |
© 2005-2022 http://www.MarketOracle.co.uk - The Market Oracle is a FREE Daily Financial Markets Analysis & Forecasting online publication.