


Is Gold Price Parabolic Blow Off Long Due?
Commodities / Gold and Silver 2011 Dec 01, 2011 - 03:45 PM GMTBy: Hubert_Moolman

 The last three major bull markets of the Dow have been followed by a bull market in gold. This is no coincidence, since these massive bull markets have been mostly driven by the huge expansion of the money supply. When this expansion of credit is exhausted, the confidence in all things (like stocks) inflated by this expansion of credit fails, causing a massive rush to gold.
There are many similarities between the period around the current bull market in gold, the period around the 70s bull market in gold and that of the Great Depression. The main difference between the period of the 70s versus those of the Great Depression and the current period is the fact that debt levels relative to GDP were much lower in the 70s.
Total US Debt as a percentage of GDP was at about 299% at its peak in the 30s, and at about 369% in 2009, versus a level of just lower than 160% during the 70s. In my opinion, this is probably one of the main reasons why the crisis of the 70s did not lead to a full-scale depression like in the 30s.
Below, is a chart by which I illustrate the similarities between the current period and that of the Great Depression:
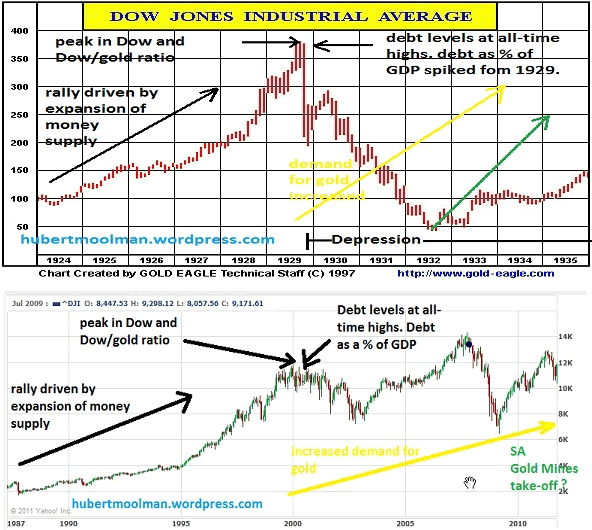
original charts by gold-eagle.com and from finance.yahoo.com
The top chart, of the above graphic, features the Dow from 1924 to 1935. During the 20's the Dow rallied significantly, mainly because of the expansion of the money supply. The Dow finally topped in 1929, at the time when debt levels were at all-time highs, with the Dow gold ratio also peaking. At the same time, Total US Debt as a percentage of GDP started spiking significantly, until it peaked in 1933. At about the same time when the stock market peaked, the demand for gold started increasing, putting pressure on the US gold reserves and eventually forcing Government to increase the price of gold. The real price of gold had been increasing steadily since 1929, until it started to accelerate at about 1932.
The bottom chart, of the above graphic, features the Dow from 1987 to 2011. The pattern of events is similar to that of before and after the 1929 Dow peak. The Dow rallied significantly during the 80s and 90s, mainly driven by the expansion of the money supply. The Dow eventually topped in 1999, at the time when debt levels were at all-time highs, with the Dow gold ratio also peaking. At the same time, Total US Debt as a percentage of GDP also started spiking significantly. At about the same time when the stock market peaked, the demand for gold started increasing, pushing the price progressively higher.
The above should make it clear that there is a relationship between the expansion of the money supply, bull markets in stocks and bull markets in gold. It is my believe that the extent of the bull market in gold is mainly determined by the extent to which credit was expanded in the years prior to the gold bull market, and the extent to which it led to an increase in things like stock values.
Based on my research, I believe we are now at a period which is similar to the end of 1932, with the worst years of the Depression, like during 1933 and 1934, almost upon us. This period will likely be longer than that of the Great Depression, bringing significant economic decline and a lower standard of living.
Gold should significantly increase the speed of its rise since 1999/2001, starting this month, December 2011, just like it did in 1932/33 (increase in gold's real price), after increasing steadily since 1929. Just like during 1933 and 1934, gold stocks are likely to be the best performing assets, over the coming years.
I have created the following charts to illustrate how the bull markets in gold could be related to that of stocks:
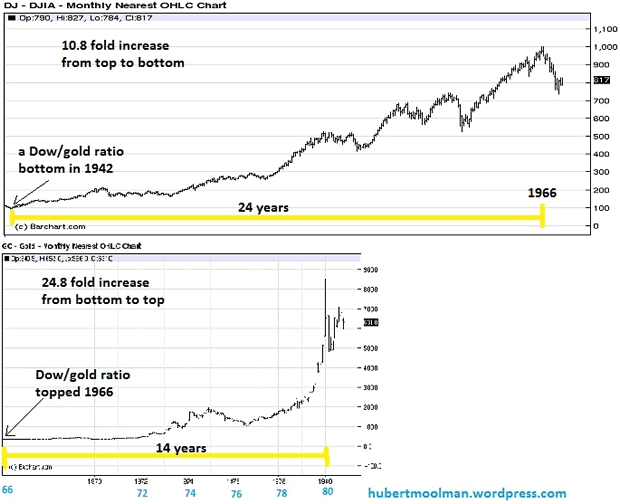
The above chart features the Dow from 1942 to 1966, and gold from 1966 to 1980. The starting and final points for both bull markets were chosen, since they represent the significant turnaround points, based on the Dow/gold ratio.
After a 24 year bull market in the Dow, and a 10.8 fold increase from top to bottom, gold started a bull market which lasted 14 years, with a 24.8 fold increase from top to bottom. Notice how different the bull market in gold developed compared to that of the Dow.
The Dow had a fairly steady rise throughout its entire bull market, whereas the gold price rose violently towards the end of the entire bull market, with a parabolic blow-off top. Also, notice that the gold price increased much faster than the Dow (14 years vs 24 years), as well as to a greater extent (24.8 years vs 10.8 years).
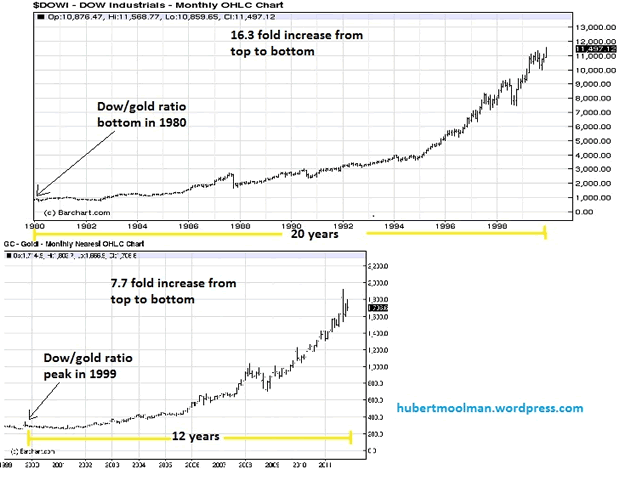
The above chart features the Dow from 1980 to 1999, and gold from 1999 to November 2011. The starting and final points for both bull markets were chosen, since they represent the significant turnaround points, based on the Dow/gold ratio.
The latest Dow bull market was 20 years long, increasing the Dow about 16.3 fold. Will gold have a more significant increase compared to its 24.8 fold increase, due to the fact that the Dow's increase was more than its previous bull market increase? If gold only matches its 1970s bull market increase, it could go to $6 200 ($250*24.8). Will the gold bull market have a similar parabolic blow-off like it did at the end of the 70s?
Notice that the gold bull market is already 12 years old. The 1970s gold bull market was about 58.3% the duration of the Dow's bull market before that. At 12 years, the current gold bull market is already 60% the duration of the last Dow bull market.
Could this mean that the gold bull market is over? Or, Could it mean that this gold bull market is not just related to the 1980 - 1999 Dow bull market, but the entire Dow bull market since silver and gold was demonetized? The end of a huge cycle. If this (the latter) is the case, then could it mean that the Gold bull market could still last for many more years, with gold going to extreme highs or even not being available for sale in Dollars? Or/and, could this further support the possibility that a parabolic blow-off is due almost immediately?
For more detailed silver analysis and silver price forecast, I have prepared a Silver Fractal Analysis Report. For more details, see my website.
Warm regards and God bless,
Hubert
Please visit my blog and website for more of my work and premium service. http://hubertmoolman.wordpress.com/
You can email any comments to hubert@hgmandassociates.co.za
© 2011 Copyright Hubert Moolman - All Rights Reserved
Disclaimer: The above is a matter of opinion provided for general information purposes only and is not intended as investment advice. Information and analysis above are derived from sources and utilising methods believed to be reliable, but we cannot accept responsibility for any losses you may incur as a result of this analysis. Individuals should consult with their personal financial advisors.
© 2005-2022 http://www.MarketOracle.co.uk - The Market Oracle is a FREE Daily Financial Markets Analysis & Forecasting online publication.