


Stock Market Downtrend Continues
Stock-Markets / Stock Markets 2011 Nov 27, 2011 - 11:43 AM GMTBy: Tony_Caldaro

 Markets lost ground for the second week in a row this week as the SPX/DOW were -4.75% and the NDX/NAZ were -4.85%. Economic reports swung slightly to the negative. On the uptick: existing home sales, personal income, PCE prices and the WLEI. On the downtick: Q3 GDP, personal spending, durable goods orders, consumer sentiment and weekly jobless claims rose. Trading in the US was cut short to three and one half days due to the Thanksgiving holiday. Economic highlights next week include: The FED’s beige book, ISM and the monthly Payrolls report. Best to your week!
LONG TERM: remaining neutral
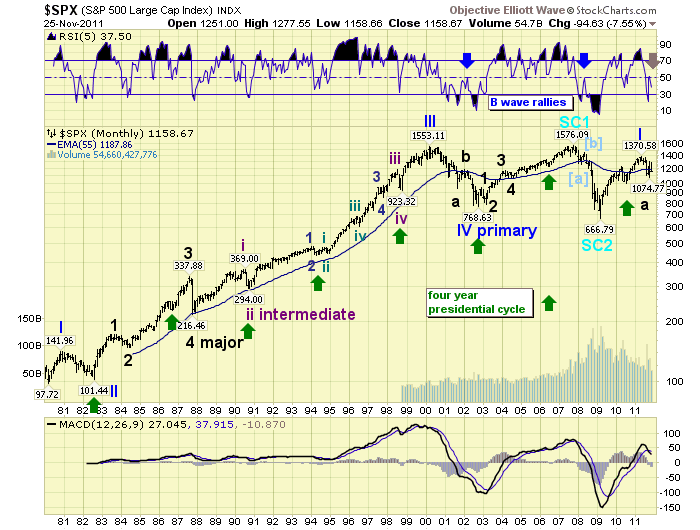
We continue to maintain two long term counts, one on the SPX charts and the other on the DOW charts. The SPX count displays a bearish five waves down from the SPX 1371 May 2011 high to complete Major wave A. Then a sharp quick rally to SPX 1293 in what appears to be a completion of Major wave B. Now, a decline to SPX 1159 (friday) in what appears to be a Major wave C underway. Should this scenario continue to unfold we can envision two potential scenarios going forward. First, and obvious to some, another five wave (trends) decline bottoming at either a 50% retracement SPX 1011, (previous Major wave 2 support) or the 70.7% retracement level at SPX 869, (previous Intemediate wave ii support). The second potential scenario would be a one wave (trend) decline to SPX 1011. At this level Major wave C would equal Major wave A and a 50% retracement of the previous bull market, Primary wave I, would have completed.
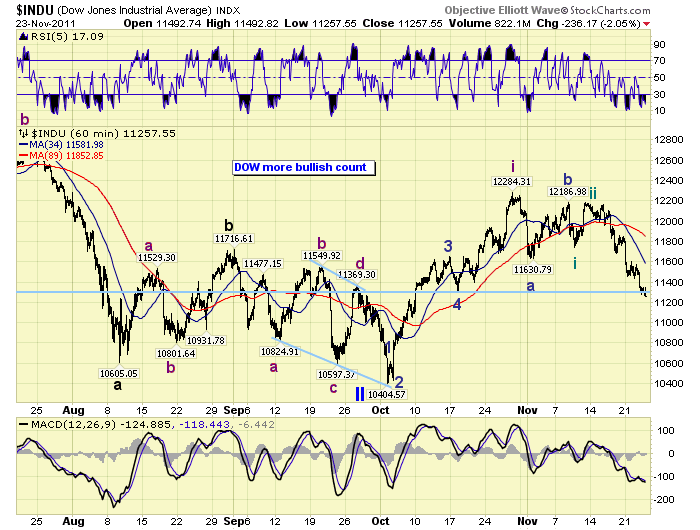
The second long term count is more bullish and is carried on the DOW charts. It suggests a correction to the Primary wave I bull market, (SPX 667-1371), ended in early October at SPX 1075 with the ending of Primary wave II. The corrective pattern took the form of an elongated flat, similar to the 1987 crash, and this first uptrend off that low was Intermediate wave i of Major wave 1 of Primary wave III. Under this count, this downtrend should take the form of a corrective ABC zigzag ending around the OEW 1136 pivot, or worse case SPX 1126 for a 76.4% retracement, similar to August 2010 decline.
When we review the technical activity on the monthly/weekly SPX charts the recent uptrend looks more and more like a B wave. Notice on the monthly chart the RSI only hit neutral during the last two bear market B waves. And, this uptrend hit neutral as well.
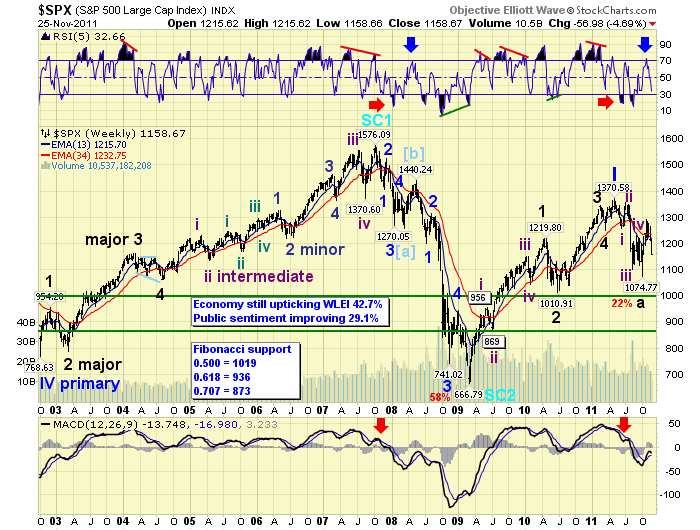
On the weekly chart. The recent uptrend just barely got overbought before turning lower. Typically, in bull markets, uptrends get quite overbought before correcting. This technical activity is also more indicative of a B wave rally than a kickoff to another leg in a bull market. The one caveat is that Major wave 1 in 2002 and Intermediate wave i in 2009 did not reach extremely overbought levels either.
MEDIUM TERM: downtrend probably underway
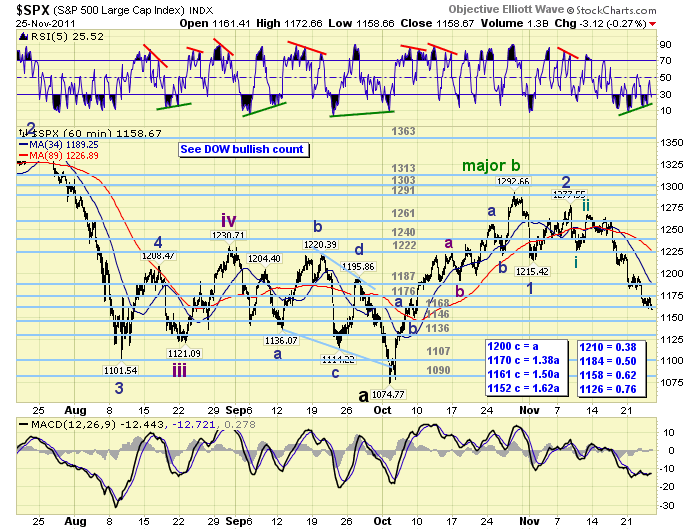
After the market rallied from SPX 1075 to 1293 in just 18 trading days. It quickly dropped to 1215, and then rallied to 1278 in a choppy corrective pattern. At that point it appeared the uptrend had ended at SPX 1293. We labeled the first decline as a Minor wave 1 or A depending on the chart, and the corrective rally as a Minor wave 2 or B. The next important decline was to SPX 1227, which was followed by a rally to 1267. We labeled those two waves as Minute wave i and Minute wave ii on both charts. The market then stalled between SPX 1244 and 1264 for a few days before starting its impulsive move down in Minute wave iii. Currently the SPX would have to rally back to the OEW 1187 pivot to confirm Minute wave iii had ended.
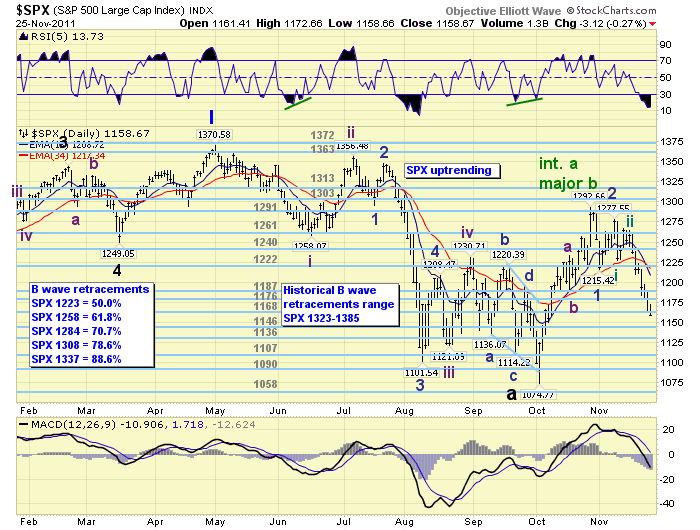
While this potential downtrend has been unfolding we have been tracking potential fibonacci retracement/support levels: SPX 1210 (38.2%), SPX 1184 (50.0%), SPX 1158 (61.8%) and SPX 1126 (76.4%). At each of the first three levels the market paused, rallied 13-15 points, and then headed lower again. Also, the decline from SPX 1278 is now between 1.50 and 1.618 times the decline from SPX 1293 to 1215. So the next important support should be around the OEW 1146 pivot range. SPX 1150 was also a significant pullback level during the recent uptrend.
On the global front. We now have 8 of the 19 international indices we track in confirmed donwtrends, with more to follow in the coming days. Three of these indices have already made new 2011 lows. We’re looking to track one more foreign index to make it an even 20, and are open to suggestions.
SHORT TERM
We posted in last week’s update: We’re obviously leaning toward a more bullish outcome but are remaining long term neutral until we are certain this potential downtrend is corrective. Should the market drop more than 10% from the SPX 1293 high, or below SPX 1164, we believe there could be trouble ahead for the market and the bullish scenario. As long as the market remains above this 10% cutoff, and completes a corrective pattern, we see the possibility of the US bull market extending in the months ahead.
On wednesday of this week, the SPX started to break down below the important support cluster between the 1168, 1176, and 1187 OEW pivots. When this started to occur our positive bias moved to neutral. Then when the SPX dropped below the 10%, 1164 cutoff level, our bias dropped to negative while remaining long term neutral. Corrections during bull markets do not usually reach 10%.
Our next set of parameters are dependent upon the wave structure of this downtrend and the level where it ends. Should this correction hold the OEW 1136 pivot, and/or, the 76.4% retracement level at SPX 1126, it will be a positive longer term if the downtrend ends in an ABC. Should these levels fail to create support and the downtrend ends in an impulsive 1-2-3-4-5 then this would be a negative longer term. In the meantime we remain long term neutral with a negative bias.
FOREIGN MARKETS
The Asian markets were all lower on the week for a net loss of 3.4%. India and Japan are in confirmed downtrends.
The European markets were all lower as well for a loss of 5.0%. Spain, Switzerland and the Stox are all in confirmed downtrends.
The Commodity equity group were all lower for a loss of 4.3%.
The DJ World lost 5.4% on the week.
COMMODITIES
Bonds are in a confirmed uptrend and gained 0.3% on the week.
Crude rallied from $76 to $103 during its recent uptrend. Upside momentum appears to be weakening as it lost 0.7% on the week.
Gold rallied from $1535 to $1804 during its recent uptrend. It lost 2.4% on the week and needs to start rallying soon to remain in an uptrend.
The USD is still uptrending from its 73.5 DXY low in August. It gained 2.1% on the week.
NEXT WEEK
Monday kicks off the economic week with New home sales at 10:00. On tuesday we have Case-Shiller, Consumer confidence and FHFA home prices. Wednesday, the ADP index, the Chicago PMI, Pending home sales and the FED’s beige book will be released. Then on thursday, weekly Jobless claims, ISM manufacturing, Construction spending, and monthly Auto sales. Then on friday, the monthly Payrolls report. The FED has one activity scheduled for the week. A speech from vice chair Yellen, at the San Francisco FED, on tuesday. Best to you and yours this holiday season.
CHARTS: http://stockcharts.com/...
http://caldaroew.spaces.live.com
After about 40 years of investing in the markets one learns that the markets are constantly changing, not only in price, but in what drives the markets. In the 1960s, the Nifty Fifty were the leaders of the stock market. In the 1970s, stock selection using Technical Analysis was important, as the market stayed with a trading range for the entire decade. In the 1980s, the market finally broke out of it doldrums, as the DOW broke through 1100 in 1982, and launched the greatest bull market on record.
Sharing is an important aspect of a life. Over 100 people have joined our group, from all walks of life, covering twenty three countries across the globe. It's been the most fun I have ever had in the market. Sharing uncommon knowledge, with investors. In hope of aiding them in finding their financial independence.
Copyright © 2011 Tony Caldaro - All Rights Reserved Disclaimer: The above is a matter of opinion provided for general information purposes only and is not intended as investment advice. Information and analysis above are derived from sources and utilising methods believed to be reliable, but we cannot accept responsibility for any losses you may incur as a result of this analysis. Individuals should consult with their personal financial advisors.
© 2005-2022 http://www.MarketOracle.co.uk - The Market Oracle is a FREE Daily Financial Markets Analysis & Forecasting online publication.