


Gold and Silver Precious Metal Charts Point to Higher Prices
Commodities / Gold and Silver 2011 Nov 21, 2011 - 02:39 AM GMTBy: Chris_Vermeulen

 Over the recent couple months the precious metals charts have made some sizable moves. Most investors and traders were caught off guard by the sharp avalanche type selloff and lost a lot of hard earned capital in just a few trading sessions. Gold dropped over 20% and silver a whopping 40%.
The crazy thing about all this is that these types of moves in precious metals can be avoided and even taken advantage of in certain situations. There is no reason for anyone to continue holding on to those positions after they pullback 6% of more because of the type of price and volume action both gold and silver had been displaying in the past few sessions.
I warned investors on Aug 31st that precious metals were about to top any day and that protective stops should be tightened or taking profits was also a smart move. It was only 2 trading sessions later that precious metals topped and went into a free fall. You can get my detailed analysis if you read my report “Dollar’s On the Verge of a Relief Rally Look Out!”.
A couple weeks later once precious metals has found support and the uneducated investor’s were licking their wounds wondering what the heck just happened to their trading accounts… I put out another report but this time with a bullish outlook. Silver was currently trading at $29.96 and I had a $35-$36 price target over the next two months. Gold was trading down at $1611 and I saw it heading back up to $1750-$1775 area before finding resistance and pulling back. Both these forecasts were reached over the next two months. You can quickly review the report called “Precious Metals Charts Point to higher Prices”for more info.
With all that said, what exactly are the charts saying right now?
Current Precious Metals Charts Summary:
The past 6 weeks we have been watching both gold and silver struggle to hold up but they have managed to grind their way to my price targets. After reaching those targets a couple weeks ago sellers have stepped back into the precious metals market and put pressure these metals.
Last week gold and silver started to pullback in a big way with rising volume. This could just be the start of something much larger which I will cover in just a moment.
The wild card for precious metals and for every stock and commodity for that matter is Europe. Every other day there seems to be headline news moving the market and most of takes place in overnight trading for those of us living in North America. It’s this wild card which is keeping me from getting aggressive in the market right now.
Let’s take a look at the charts…
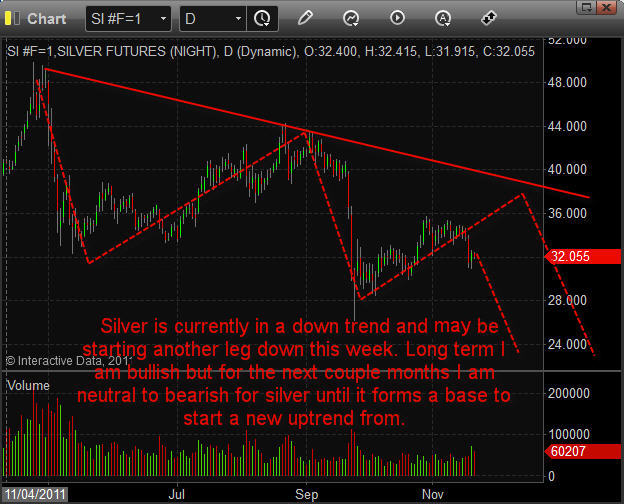
Silver Precious Metals Chart:
Silver is currently in a down trend and may be starting another leg down this week. Long term I am bullish but for the next couple months I am remain neutral to bearish for silver until it forms a base to start a new uptrend from.
Precious Metals Charts
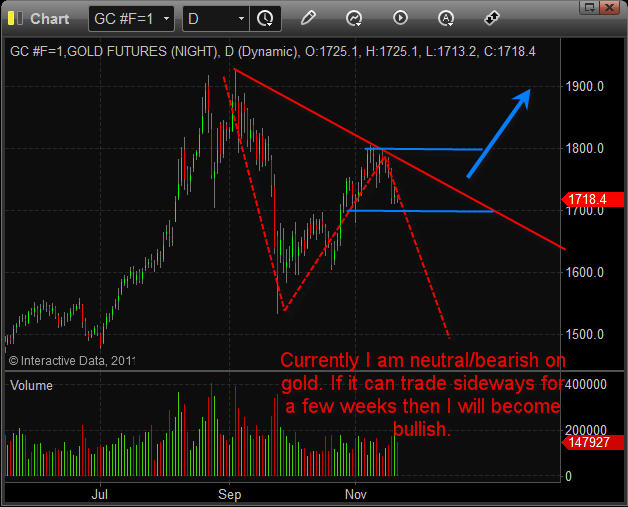
Gold Precious Metals Chart:
Currently I am neutral/bearish on gold. If it can trade sideways for a few weeks then I will become bullish.
Precious-Metals-Charts
Precious Metals Charts Conclusion:
In short, I feel there is a good chance the US dollar will continue higher and if that happens we should see strong selling in North American equities, commodities and likely on the precious metals charts.
Financial markets around the world are at a tipping point meaning something really big is about to take place. The question is which way will investment move. The only thing we can do is trade with the current trends, price patterns and volume.
At this time I still see a higher dollar and that means lower stocks and commodities. This could change at the drop of a hat depending on the news that comes out of Europe so the key to trading right now is to remain cash rich and taking only small positions in the market.
If you would like learn more about etf trading and receive my daily pre-market videos, intraday updates and detailed trade alerts which even the most novice trader can follow then join my FREE trading education newsletter and my premium trading alert service here: http://www.GoldAndOilGuy.com
By Chris Vermeulen
Chris@TheGoldAndOilGuy.com
Please visit my website for more information. http://www.TheGoldAndOilGuy.com
Chris Vermeulen is Founder of the popular trading site TheGoldAndOilGuy.com. There he shares his highly successful, low-risk trading method. For 6 years Chris has been a leader in teaching others to skillfully trade in gold, oil, and silver in both bull and bear markets. Subscribers to his service depend on Chris' uniquely consistent investment opportunities that carry exceptionally low risk and high return.
This article is intended solely for information purposes. The opinions are those of the author only. Please conduct further research and consult your financial advisor before making any investment/trading decision. No responsibility can be accepted for losses that may result as a consequence of trading on the basis of this analysis.
Chris Vermeulen Archive |
© 2005-2022 http://www.MarketOracle.co.uk - The Market Oracle is a FREE Daily Financial Markets Analysis & Forecasting online publication.