


How to Trade Oil ETFs when $100p/b is Reached
Commodities / Crude Oil Nov 14, 2011 - 01:11 AM GMTBy: Chris_Vermeulen

 Crude oil was THE commodity to trade back in 2007-2008 when prices rocketed above $145 per barrel then dropped like a rock all the way back down to $35 per barrel leaving many investors and traders either greatly rewarded or dead broke.
Since then the focus of the world has moved to gold and silver as currencies spiral out of control with more and more reasons why individuals and entire countries should focus on owning physical metals rather than eroding currencies.
Just because a commodity is not under the direct spot light does not mean you can’t trade it or make money from it. With that said here is my analysis on how to trade oil if $100 per barrel is reached in the coming trading days.
Let’s take a look at the charts…
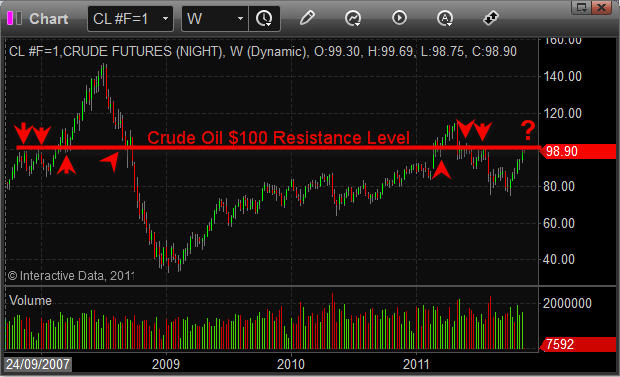
Long Term Weekly Oil Futures Chart
Here you can see how oil is trading round the $100 level. When the price is trading below it then $100 will act as resistance and when oil is above then it becomes support.
How To Trade Oil ETF
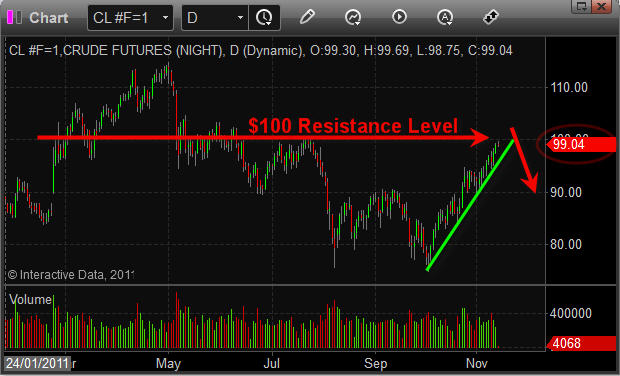
Intermediate Term Daily Oil Trading Chart:
This is more of a close up look at oil and the $100 price point. Notice how oil has moved higher for an entire month without any real pullbacks and that it has a clean support trend line underneath. If oil sees some big sellers step in here at the $100 – $104 level then I expect the green support trend line to be broken. If that takes place oil could quickly and easily drop back down to the $90-$92 area.
How To Trade Crude Oil
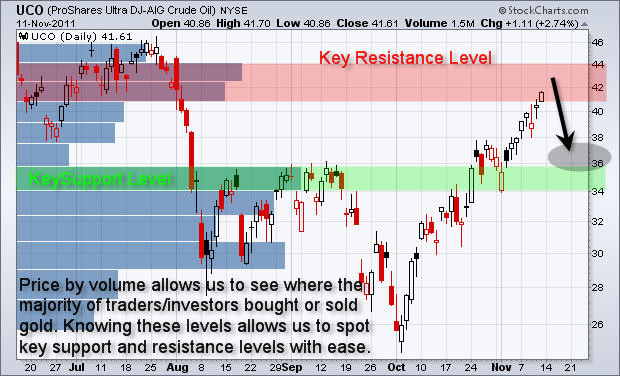
How to Trade Oil Using an Oil ETF
This chart shows a long (bullish) oil ETF along with its price by volume levels. I like to review the price by volume analysis from time to time when nearing a major support or resistance level on a chart. For those who have difficulty finding support and resistance levels then this indicator/volume analysis tool will take most of your guess work out of the equation.
To make a long story short, the longer the volume bars on the left side of the chart are then the more people either bought or sold crude oil at that price. Keep in mind that it does not matter if they bought or sold here… the key to remember is that there are a lot of new positions here and that is where people exit their positions at breakeven because they held such a large draw down over the past few months and just want their money back.
Most traders and investors who trade off pure emotions (fear/greed) would have held a losing position through the August – October selloff and are now going to be more than happy to exit the trade at breakeven and move on to the next emotional roller coaster. It’s this type of trading which allows the non-emotional traders who thrive off of price action and mass psychology to catch price swings in the oil market.
The chart below clearly shows that oil is entering into resistance level and a pullback is becoming more likely each day. Those looking for an etf how to trade oil should look at buying SCO ETF. This oil ETF goes up in value when oil loses value.
How To Trade Oil ETFs
How to Trade Oil and Oil ETFs Conclusion:
In short, oil is becoming overbought meaning it has moved up to far too fast and should have some profit taking shortly. The fact the oil is reaching a century number ($100) I feel there will be a couple days of selling starting soon. Traders looking to play this support trendline breakdown should look at trading SCO oil etf.
If you would like to get more of my daily analysis to join my newsletter at www.GoldAndOilGuy.com
By Chris Vermeulen
Chris@TheGoldAndOilGuy.com
Please visit my website for more information. http://www.TheGoldAndOilGuy.com
Chris Vermeulen is Founder of the popular trading site TheGoldAndOilGuy.com. There he shares his highly successful, low-risk trading method. For 6 years Chris has been a leader in teaching others to skillfully trade in gold, oil, and silver in both bull and bear markets. Subscribers to his service depend on Chris' uniquely consistent investment opportunities that carry exceptionally low risk and high return.
This article is intended solely for information purposes. The opinions are those of the author only. Please conduct further research and consult your financial advisor before making any investment/trading decision. No responsibility can be accepted for losses that may result as a consequence of trading on the basis of this analysis.
Chris Vermeulen Archive |
© 2005-2022 http://www.MarketOracle.co.uk - The Market Oracle is a FREE Daily Financial Markets Analysis & Forecasting online publication.