Stock Market Intermediate Trend Still Alive
Stock-Markets / Stock Markets 2011 Nov 07, 2011 - 03:35 AM GMTBy: Andre_Gratian
 SPX: Very Long-term trend - The very-long-term cycles are down and, if they make their lows when expected, there will be another steep and prolonged decline (which appears to have already started) into 2014.
SPX: Intermediate trend - The intermediate trend which started at 1075 as a proposed bear market rally is still alive. Should the strength continue for a period of time, the concept of being in a bear market will have to be re-visited.
Analysis of the short-term trend is done on a daily basis with the help of hourly charts. It is an important adjunct to the analysis of daily and weekly charts which discusses the course of longer market trends.
Market Overview
The market appears to have survived a steep correction and it looks as if the uptrend is still viable. This is perhaps best observed on the weekly charts. To resume its downtrend, the SPX would have had to close decisively below 1220 on a daily basis (but even that would not guarantee that we'd be on our way to making a new "bear market" low). Instead, it bounced back up and started a near-term uptrend which retraced .618% of the decline. It opened down on Friday, but could not follow through with the morning weakness, and closed on the high of the day. This is good technical action which suggests that there is more to come on the upside before the rally (which started at 1075) has reached its zenith.
Prices have been volatilely connected to the Eurozone situation. Now that the plans for a referendum have been cancelled, and the Greek prime minister has squeaked by on a vote of confidence and intends to resign, temporary stability has returned which may allow the SPX to reach its final rally target of 1310-1320.
In fact, the weekly charts suggest that the indices are just breaking out of their last intermediate downtrend, and they may have some distance to go before the new uptrend is complete. We'll start by looking at a weekly chart.
Chart analysis
As an example, I have chosen an index which best embodies my bullish slant. It's the Dow Jones Composite Average. I have already discussed this index and mentioned that it would probably make a new high before its bull market ended. There appears to be a dichotomy among equity indices: those which are still in a bull market, and those that may already have reached the end of their long-term bullish trek. This index looks as if it will be making a new high before its trend reverses. Another one is the QQQ.
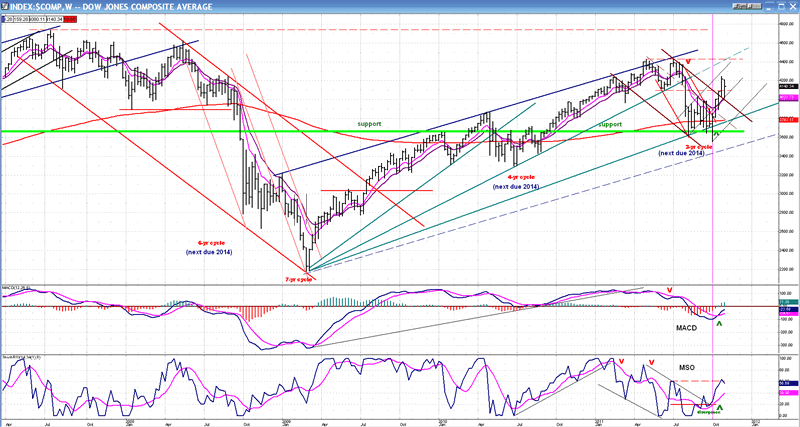
One of the reasons I chose this chart is to refresh your memory about where we are heading, eventually. As you can see, each cycle low reads: " next due 2014". At some point, we will have reached a major top, and it will be straight down into the 2014 120-yr cycle bottom and that of all its components. But it's probably still a few weeks -- and perhaps months -- away.
Looking at the indicators, it's pretty clear that we are still in an uptrend. Both of them have crossed, and the blue line is still well above the pink one. Also, the MSO is approximately in the middle of its range. It normally rises to the top and, more often than not, shows negative divergence before a reversal takes place in the index price.
Let's now take a look at the Daily SPX Chart.
The index is coming out of its (red) intermediate down channel. The market volatility caused it to briefly re-enter the channel, but it bounced back outside immediately, and has closed outside of it two consecutive days. Also, note that the last two days found support on the 200-DMA which has now been decisively surpassed.
Several channels have developed for the uptrend which started at 1075. The trend will gradually shift from the steepest to the widest. Once the widest one has been penetrated on the downside, we will perhaps have started the long descent into 2014. Obviously, this is not around the corner. When the SPX reached the 1292 projection, it also reached the top of the broadest channel. Actually, another, even steeper one could have been drawn, and if it proves to be the best one to define the price trend, it will replace the dark-blue channel.
The horizontal light green line was drawn across the previous tops, and it proved to be strong support for the reaction from 1292. If the dark-blue channel is the correct one, the next rally should stop at its top trend line. If the move is especially strong, it could punch through and continue all the way to the line which connects the two tops.
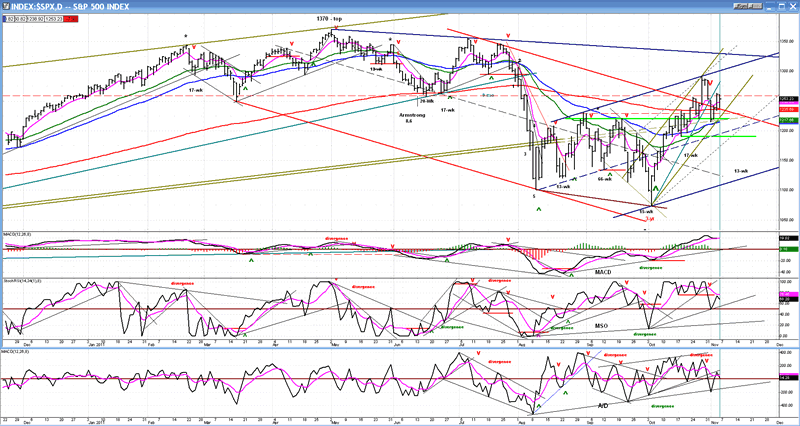
Last week, I mentioned that the MACD was very strong and that it was not showing negative divergence, and that this could suggest that the top of the rally from 1075 had not been reached, yet. The MACD is still strongly positive and has only gone flat in the recent pull-back. The MSO also remains positive, and the A/D briefly dipped into negative territory, but has rebounded. The trend line which connects the bottoms of the A/D oscillator is still intact. All these suggest that there are no present threats to the uptrend.
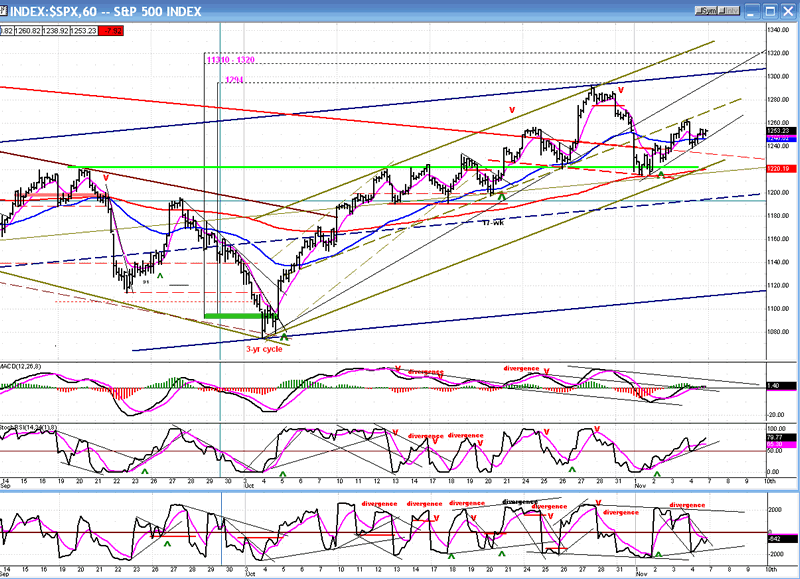
The Hourly Chart gives us a close-up view of the channels which define the current uptrend. The dark-blue is the main channel, and the yellow-green, the more narrow channel from 1075. The colors are the same as those in the daily chart, above, so that you can get a good sense of how the two time frames correlate. The pull-back did not make it all the way across the smaller channel. Strong support from previous tops and from the 200-hr MA held the index before the lower line could be reached. This could be a sign of upward acceleration.
The initial thrust took prices to the mid-channel line. The indicators look ready to resume their uptrend, but the index will have to move through mid-channel resistance if it is to reach the higher projection (these have been left on the chart from a past newsletter). The move from the low essentially reached the 1294 target before it was turned back. The next projection is 1310-3220. That's a little beyond the top of the larger channel which should provide some resistance. Whether we get there or not, this is likely to be the last attempt at going up before another reversal. It's too early to tell how significant it will be. We do know that it's a long way down to the bottom of the widest channel, and there are no significant cycles which seem capable of bringing that much short-term weakness.
Cycles
The closest cycle is the 13-wk cycle due on the 15th, but it could turn out to be a high instead of a low. Beyond that, there is nothing of substance on the horizon until next year.
That does not mean that we cannot have another significant decline. All we need is a little more turmoil in the Eurozone and the indices will take another plunge.
Breadth
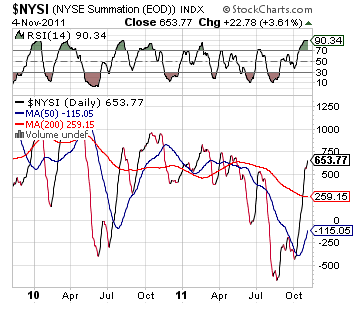
The NYSE Summation Index (courtesy of StockCharts.com) confirms the strength in the market. It has now surpassed its July high which was the secondary top of 1356 in the SPX. This is consistent with other indications that at least some indices - such as the QQQ - will make new highs before a major top is reached. For the time being, we'll stay with the possibility that a bear market has started in other indices, but if the prevailing strength does not abate fairly soon, I may have to change my opinion about that.
Sentiment
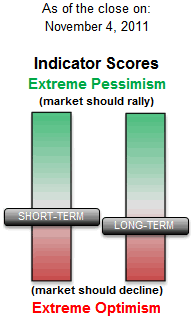
The SentimenTrader (courtesy of same) has been getting more negative, but it has some room to go before signaling a major top.
QQQ
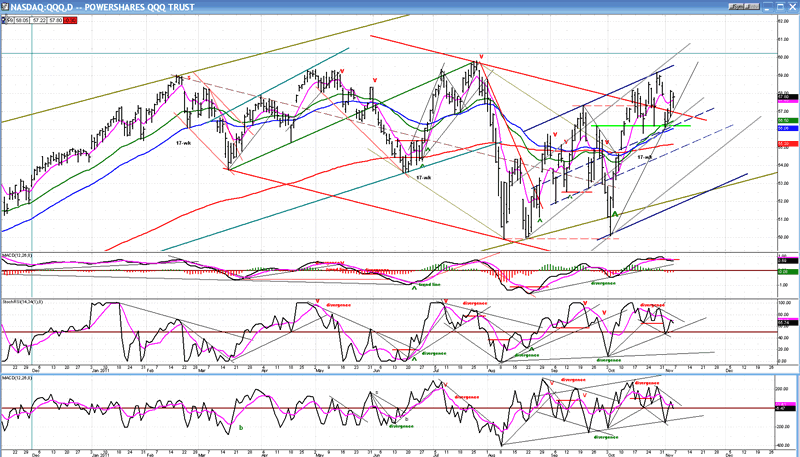
Instead of showing you the NDX/SPX ratio, I am going to show you a Daily Chart of the QQQ so that you can compare it with the SPX. The two charts are similar, but not exact. The structure is somewhat different, as are the smaller channels, but the larger channel shows the same bullish intermediate pattern as the SPX.
If another little thrust does occur over the near-term, the index will challenge its former high. Just as the SPX has some unfilled higher counts, so does the QQQ. It should be able to reach 59.50 before reversing. That would fall a little short of the 59.81 high. Longer term, however, the QQQ has higher projections, perhaps as high as 64.
The indicators are almost identical to those of the SPX, and can be interpreted in the same manner.
VIX
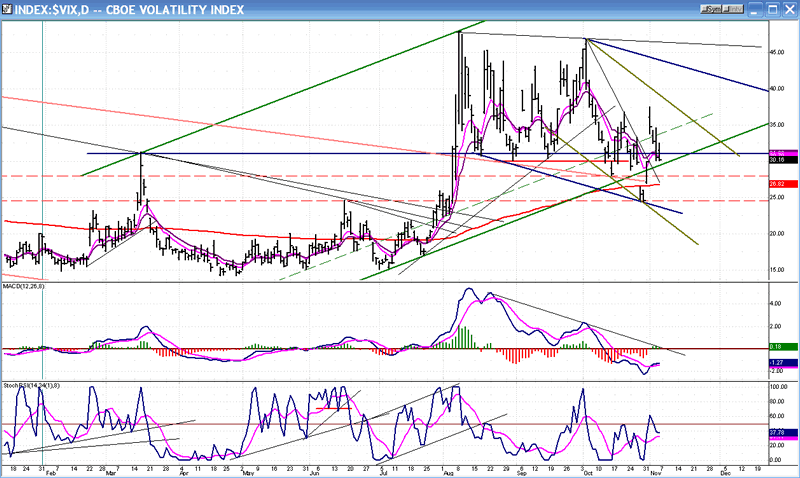
If the equity indices are in bullish intermediate price trends, the VIX should be in an intermediate downtrend, and it looks as if one may have started. The channels are essentially the reverse of those of the equity indices. As long as VIX remains in those channels, it will suggest that the SPX et al... will remain in an uptrend.
GLD
I will conclude this letter with another peek at gold or, to be exact, at its ETF, GLD. This is a Weekly Chart which shows the long-term view.
GLD lends itself well to various analytic methodologies: EW analysis, Fibonacci target points, and Point & Figure projections, as well as to conventional technical analysis. That makes it a fairly predictable index to analyze. After reaching its interim projection of 187-189 -- which coincided with the intersection of two upper channel trend lines -- GLD went into a normal consolidation period which should conform to the methodologies listed above.
Most likely, GLD is in an a-b-c corrective pattern. The "a" wave retraced slightly more than .236 of its total uptrend from November 2008 and found support at the previous high of 153.61(the low of "a" was actually 154.19). The "b" wave is still in progress, but is probably nearing completion, and most likely going for a .618 retracement of its "a" wave which coincides with the 173-74 overhead resistance level (red dashed line). There is also a re-accumulation P&F phase count to 173-74. It makes that level a good point from which to reverse and start the "c" wave. Should the index go past 175, its intention may be to use up the entire re-accumulation base count and retest its high of 186.
If the "b" wave stops at 173-174 and the price reverses, we can probably expect the "c" wave to retrace to .382 of the entire uptrend and find support at level #2 which closely matches a P&F projection of 143.
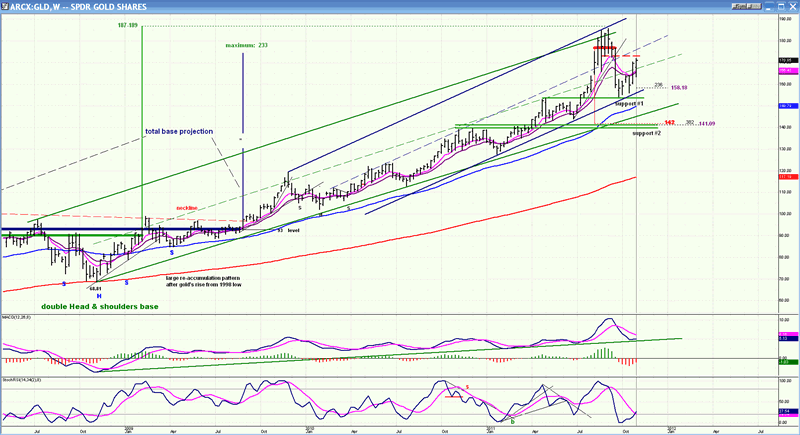
There is no guarantee that GLD will follow this exact script, but it is certainly something worth considering.
Summary
"Bulls should exercise caution over the next few days." This is how I started my summary a week ago. That warning was well warranted since the SPX started the week with a two-day retracement of 72 points.
There is no such warning this week. If anything, the SPX is likely to make a new recovery high -- perhaps to its 1310-1320 projection -- before ending its rally from 1075. After that, it will be vulnerable to another correction which should be a normal retracement within the intermediate uptrend channel. This channel is delineated on the above SPX daily chart in dark-blue lines.
FREE TRIAL SUBSCRIPTON
If precision in market timing for all time frames is something which is important to you, you should consider a trial subscription to my service. It is free, and you will have four weeks to evaluate its worth.
For a FREE 4-week trial. Send an email to: ajg@cybertrails.com
For further subscription options, payment plans, and for important general information, I encourage you to visit my website at www.marketurningpoints.com. It contains summaries of my background, my investment and trading strategies and my unique method of intra-day communication with Market Turning Points subscribers.
By Andre Gratian
MarketTurningPoints.com
A market advisory service should be evaluated on the basis of its forecasting accuracy and cost. At $25.00 per month, this service is probably the best all-around value. Two areas of analysis that are unmatched anywhere else -- cycles (from 2.5-wk to 18-years and longer) and accurate, coordinated Point & Figure and Fibonacci projections -- are combined with other methodologies to bring you weekly reports and frequent daily updates.
“By the Law of Periodical Repetition, everything which has happened once must happen again, and again, and again -- and not capriciously, but at regular periods, and each thing in its own period, not another’s, and each obeying its own law … The same Nature which delights in periodical repetition in the sky is the Nature which orders the affairs of the earth. Let us not underrate the value of that hint.” -- Mark Twain
You may also want to visit the Market Turning Points website to familiarize yourself with my philosophy and strategy.www.marketurningpoints.com
Disclaimer - The above comments about the financial markets are based purely on what I consider to be sound technical analysis principles uncompromised by fundamental considerations. They represent my own opinion and are not meant to be construed as trading or investment advice, but are offered as an analytical point of view which might be of interest to those who follow stock market cycles and technical analysis.
Andre Gratian Archive |
© 2005-2022 http://www.MarketOracle.co.uk - The Market Oracle is a FREE Daily Financial Markets Analysis & Forecasting online publication.


