


Stock Market Update Still Underway
Stock-Markets / Stock Markets 2011 Nov 05, 2011 - 11:34 AM GMTBy: Tony_Caldaro

 After four successive weeks of rising prices the major indices pulled back this week. The hardest hit was Europe with a 4.8% decline, Asian markets were -0.9%, and the US markets were -2.25%. On the economic front upticking and downticking reports were about even. On the upside: ADP, factory orders, the unemployment rate, the WLEI and weekly jobless claims improved. On the downside: ISM manufacturing/services, the Chicago PMI, construction spending, auto sales, the monetary base, and the payrolls report. The economy is still in contraction mode. For the week the SPX/DOW were -2.35%, and the NDX/NAZ were -1.9%. Bonds rose 1.7%, Crude gained 0.7%, Gold gained 0.7%, and the USD was +2.5%. Next week’s economic reports will be highlighted by the Trade/Budget deficits, Import/Export prices and Consumer sentiment.
LONG TERM: neutral
When we started to observe, and report, many technical negative signs were building during the June-July period we anticipated the bull market top was in at SPX 1371, and we were about to enter a bear market. The market sold off quite rapidly in early August to SPX 1102 and then remained quite volatile for weeks. At that low, however, the market was quite oversold for a bear market. And, many other technical indicators also suggested this bear market would not be as severe as the last. Which was about what we were expecting longer term, but not this soon. After an uptrend to SPX 1231 in August the market hit an important low at 1075 in October.
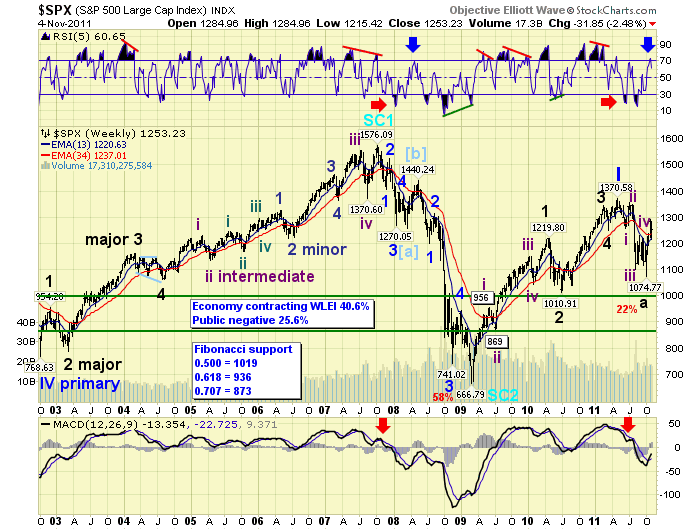
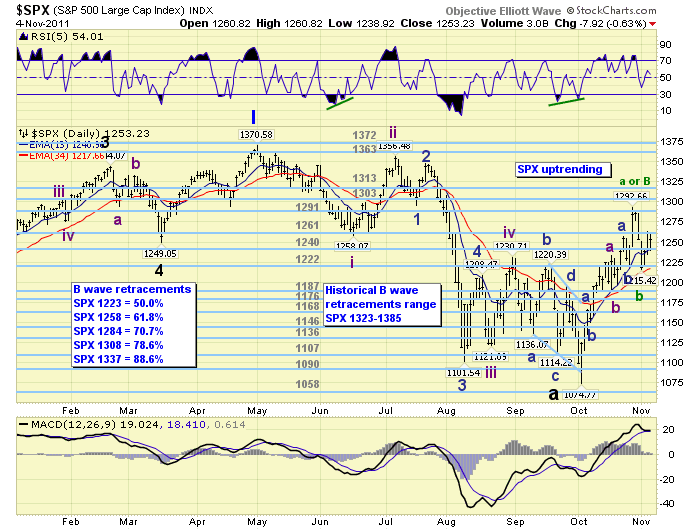
It appeared the market had hit an A wave low at the October bottom, and was rallying in an expected B wave. We had estimated this B wave would retrace 50.0% to 61.8% of the entire previous decline, i.e. SPX 1223 to 1258. The market did just that, and more. After just 18 trading days the market had rallied to SPX 1293. We had done some historical work on bear markets and bear market rallies, of this wave degree, and determined the market could now continue to rally to within -3.5% to +1.0% of the previous high, i.e. SPX 1323 to 1385. All these reports were posted over the past four weeks in the weekend updates.
Last week we noted this uptrend was looking quite impulsive. This is unusual for a bear market rally. While we did identify the October low within two days of the bottom, expecting a bear market rally. We had to shift to long term neutral pending the final wave formation of this uptrend, and the subsequent downtrend. If it remains impulsive, and the next downtrend is corrective, we will switch to long term bull market. If it gets choppy before it concludes, a B wave bear market rally would be underway, and will will switch to long term bear market. One might call this another inflection point for the stock market.
MEDIUM TERM: uptrend high SPX 1293
The current uptrend from SPX 1075 to 1293 can be counted in a number of ways. First, a Major B wave rally retracing about 74% of the entire decline. Second, an Intermediate wave A and B, of Major wave B, with Intermediate wave C underway now. Third, a five wave Intermediate wave i rally with Int. wave ii at the recent SPX 1215 low, and Int. wave iii underway now. Or fourth, the entirety of Int. wave i at SPX 1293 and Int. wave ii underway now. This leaves many options open for market direction during the next few weeks.
The ones with the highest probability of these four potential counts are numbers two and three. These are the two counts posted on the SPX and DOW charts.
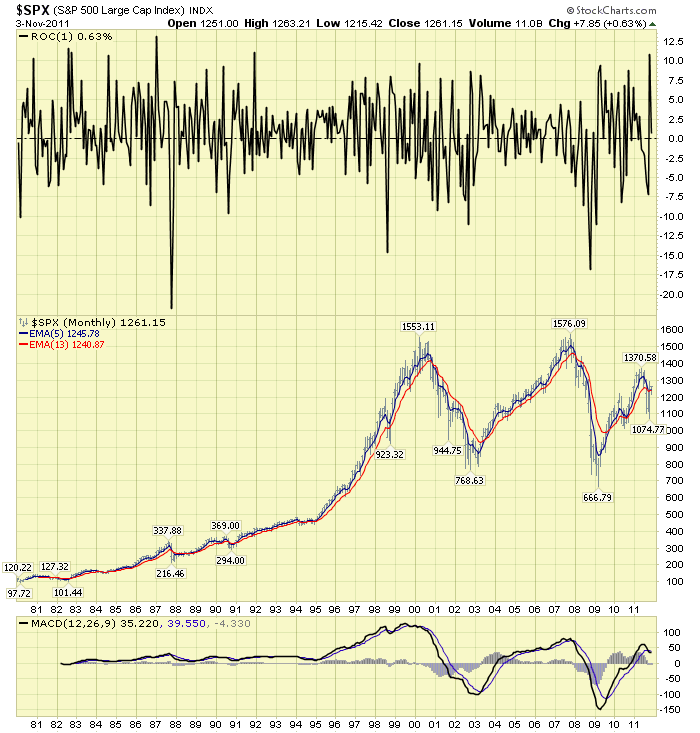
Of these two we would have to give a slight edge to number three for the following reasons. First, the entire uptrend thus far looks impulsive, not corrective. Second, the market gained 20.3%, and retraced 74% of the decline, in just 18 trading days. This is quite unusual for a B wave rally. Third, the market gained 10.8% for the month of October. We have not had a monthly gain of 10% or more in any month since 1991. These types of events are quite rare. In the past 30 years they have occurred only four other times: 1980, 1982, 1984 and 1987. And, only two times coming off significant lows: 1982 and 1984. Both of these events were kickoffs to bull markets.
For now, the market is uptrending from last month’s SPX 1075 low. It continues to look impulsive. But we are observing how it concludes and how the next downtrend concludes as well. In the meantime we remain long term neutral.
SHORT TERM
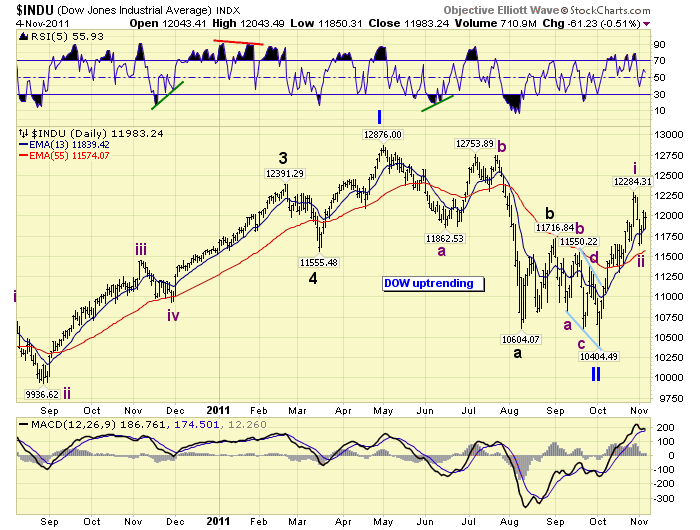
Support for the SPX is at 1240 and then 1222, with resistance at 1261 and then 1291. Short term momentum finished the week above neutral and rising. During the rally from SPX 1075 to 1293 the market had six pullbacks of 20+ points. The price pattern suggests this was a five wave advance. This count is posted on the DOW hourly chart.
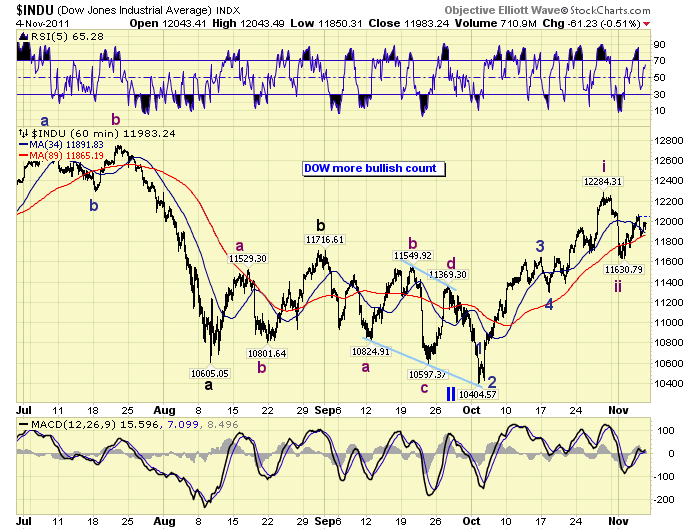
The recent three day decline from SPX 1293 to 1215 was the largest pullback since the uptrend began in early October. This suggests that five wave structure completed at the high, and another five wave structure may be just beginning.
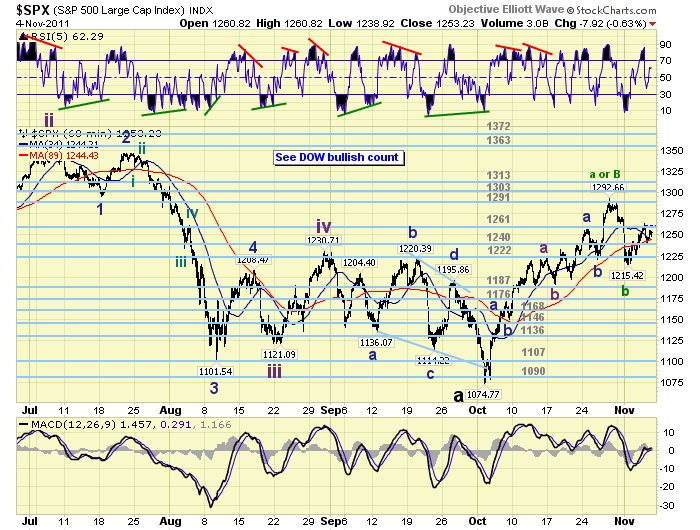
After the SPX 1215 low was hit on tuesday the market rallied to 1263 on thursday, got quite overbought, and then pulled back 24 points into friday’s low. Another 20+ point pullback. As long as the OEW 1222 pivot range holds support we should see this uptrend continue with higher prices ahead. Should this pivot fail to hold and the market drop to the next OEW pivot at 1187 the uptrend may be over. The only resistance between friday’s closing price SPX 1253 and new highs, is first the 1261 pivot and then the 1291 pivot.
If this next rally is an Int. C wave of a larger Major wave B, scenario #2, it should run into resistance at the following levels. At SPX 1324 Int. C = 0.50 Int. A, and at SPX 1350 Int. C = 0.618 Int. A. Both of these levels fall in between the Major B SPX 1323 to 1384 retesting the high scenario. If it is indeed Int. wave iii, it will not equal Int. i until the market reaches SPX 1433. The next few weeks could prove to be quite interesting. Best to your trading!
FOREIGN MARKETS
The Asian market lost 0.9% for the week. All five indices are in confirmed uptrends except Hong Kong’s HSI.
The European markets lost 4.8% on the week. All five indices are in confirmed uptrends.
The Commodity Equity group lost 2.0% for the week. Only Brazil’s BVSP is in a confirmed uptrend.
The DJ World index is uptrending but lost 3.7% on the week.
COMMODITIES
Bonds rallied strongly this week, +1.7%. Most of the gains came on monday/tuesday as the stock market declined. They remain in a confirmed downtrend.
Crude continues its uptrend gaining 0.7% on the week.
Gold and Silver continue their uptrends gaining 0.7% and losing 3.5% respectively.
The USD had a big rally +2.5% and remains in an uptrend. The downtrending EURUSD lost 2.7%, and the now downtrending JPYUSD lost 3.0% after BOJ intervention.
NEXT WEEK
The economic week kicks off on monday with Consumer credit at 3:00. Then on wednesday we have Wholesale inventories. On thursday weekly Jobless claims, Import/Export prices and the Trade/Budget deficits. On friday Consumer sentiment. The FED has a busy week. On wednesday FED chairman Bernanke gives opening remarks at a conference in Wash, DC. Also on wednesday FED governor Tarullo gives a speech in NYC. Then on thursday FED chairman Bernanke speaks at a town hall meeting in Texas. Friday is a federal holiday, Veterans Day. Best to you and yours this weekend and week!
CHARTS: http://stockcharts.com/...
http://caldaroew.spaces.live.com
After about 40 years of investing in the markets one learns that the markets are constantly changing, not only in price, but in what drives the markets. In the 1960s, the Nifty Fifty were the leaders of the stock market. In the 1970s, stock selection using Technical Analysis was important, as the market stayed with a trading range for the entire decade. In the 1980s, the market finally broke out of it doldrums, as the DOW broke through 1100 in 1982, and launched the greatest bull market on record.
Sharing is an important aspect of a life. Over 100 people have joined our group, from all walks of life, covering twenty three countries across the globe. It's been the most fun I have ever had in the market. Sharing uncommon knowledge, with investors. In hope of aiding them in finding their financial independence.
Copyright © 2011 Tony Caldaro - All Rights Reserved Disclaimer: The above is a matter of opinion provided for general information purposes only and is not intended as investment advice. Information and analysis above are derived from sources and utilising methods believed to be reliable, but we cannot accept responsibility for any losses you may incur as a result of this analysis. Individuals should consult with their personal financial advisors.
© 2005-2022 http://www.MarketOracle.co.uk - The Market Oracle is a FREE Daily Financial Markets Analysis & Forecasting online publication.