


Stock Market Time for Caution
Stock-Markets / Stock Markets 2011 Oct 31, 2011 - 02:31 AM GMTBy: Andre_Gratian

 SPX: Very Long-term trend - The very-long-term cycles are down and, if they make their lows when expected, there will be another steep and prolonged decline (which appears to have already started) into 2014.
SPX: Intermediate trend - The intermediate trend which started at 1075 as a bear market rally may be about to end shortly. Time for caution!
Analysis of the short-term trend is done on a daily basis with the help of hourly charts. It is an important adjunct to the analysis of daily and weekly charts which discusses the course of longer market trends.
Market Overview
The title of this newsletter advises caution. There are several reasons for this. The SPX Point & Figure chart has several projections (taken from different levels) which target a top between 1310 and 1320. That, by itself, should be reason for caution. Especially when some indices which run counter to the market and have been in a corrective phase, such as TLT and the VIX appear to be very close to fulfilling their downside P&F potential.
Structural analysis also suggests that we are approaching a top. There is a strong probability that the rally from the early October low has progressed as an a-b-c structure. Although the "b" wave is hardly noticeable on a daily chart of the SPX, it is clearer on the hourly chart, especially on that of the Global Dow and other indices. If this is correct, the entire pattern from the low is evolving in the form of a zig-zag. On Friday, it looked as if we may have completed wave 3 of the second five-wave pattern. That only leaves two short waves (4 and 5) to finish the move before we have a serious retracement. Some EW analysts see this pattern as minor wave 2 of a bear market rally, with wave 3 starting as early as next week.
That seems to fit in with what some serious cycle analysts such as Erik Hadik are saying. And there is also a warning from Raymond Merriman, the well-known financial astrologer, that the Jupiterian influence which he believes was the reason behind the rally should soon begin to wane. It does not hurt to have some reputed analysts who specialize in other market methodologies support your point of view! Hence the warning: CAUTION, if you are a bull!
In today's market climate, moves are very fast and do not stop until they have exhausted their potential projections. This is probably why the B wave retracement was so insignificant. We should therefore guard against "expecting" a sideways pattern, or a mild retracement, just because we've had all the strength, especially if the EW analysts are correct in anticipating the imminent end to minor wave 2. If we are about to start minor wave 3, you can't look for a shallow, partial retracement of wave 2. The odds rather favor a potential retracement of the entire rally - as incredible as this may seem at this time.
Chart analysis
Let's look at the Daily Chart of the SPX. This spectacular rally has been so strong that it did not even have much of a correction since its inception in early October. It has gone right thru the 50-DMA, the former short-term highs, the 200-DMA, and has even penetrated substantially into the thick overhead layer of resistance which starts at 1258. It's more than overdue for a correction, and this is what the P&F projection, as well as the structure, is calling for.
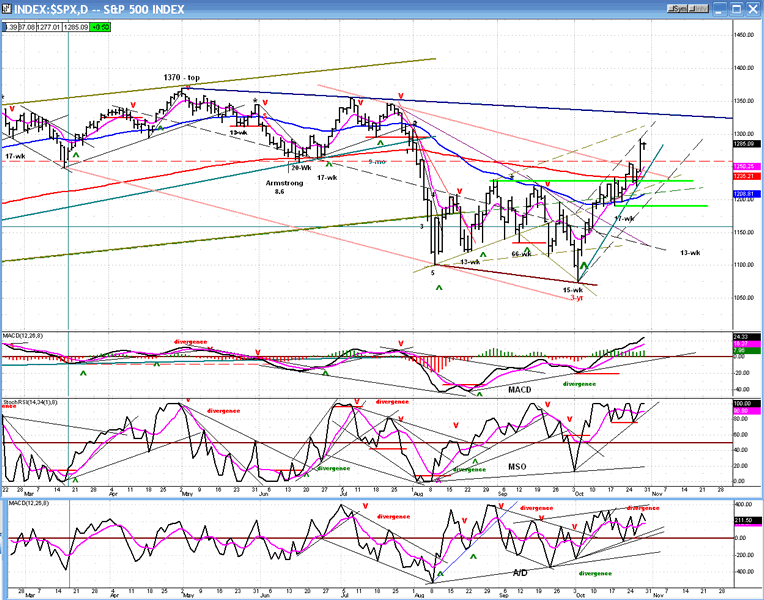
The indicators reflect the strength of the rally. The MACD has been in an uptrend since the beginning and is still rising. This indicator, especially, leads one to wonder how much of a correction we could have. It is rare that a large correction can start when there is that much strength in the MACD. However, we won't form any mind set about this. We'll just let the market tell us what it wants to do.
The other momentum oscillator (the MSO) is a better indicator of an overbought or oversold market. It routinely oscillates between 100% and 0%. In this case, it has hit 100% several times over the past three weeks, and closed on Thursday and Friday at 100%. Normally, some negative divergence will show in the MSO by the time a top is reached. There is none, this time. The only place where we find a trace of potential weakness is in the A/D oscillator. It is still in an uptrend, but some mild negative divergence is beginning to appear. Since it is normally the leader, let's see if the others follow.
I have marked on the chart with a light green line the levels where the SPX should find initial support after it reverses. We could pause there and form a top for a few days before moving lower. The topping pattern on the P&F chart should give us some clue about what to expect.
The chart also shows a (dark blue) trend line which is drawn across the two previous tops. Since it is positioned at the top of the thick resistance layer, it is very unlikely that we can go through it without at least, some consolidation. And if the structure and P&F count are correct, we should not even get close enough to challenge it on this move.
Let's continue with the Hourly Chart. The two lower projections were given last week. They have already been filled, with the SPX pausing only briefly at the 1271 target and quickly moving on to the higher one for a likely completion of wave 3. Wave 4 looks incomplete and may require another small pull-back. I have added the new target range of 1310-1320 which, if the count is correct, should see the (temporary?) end of the rally.
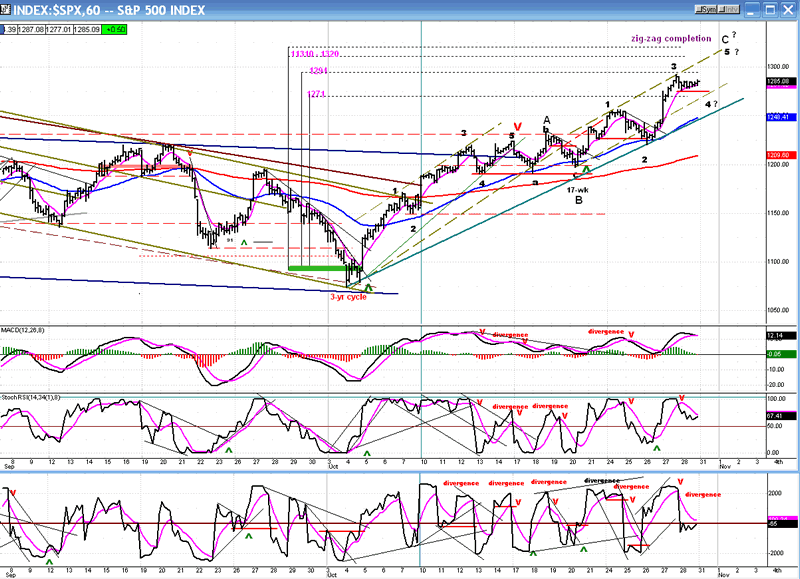
As of Friday's close, the indicators had only given a preliminary sell signal. For it to be confirmed, the index would need to close below the small red horizontal line on an hourly basis. Considering the negative divergence in two of the three indicators, it is likely that we will get the additional pull-back before moving higher.
When the green uptrend line is broken, it should signal the end of the rally, but that should not happen before the structure has been completed.
Breadth
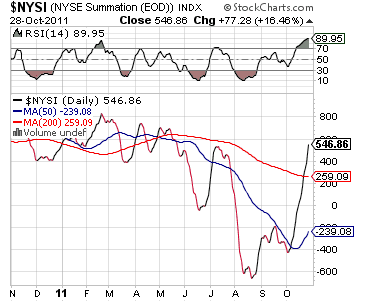
The NYSE Summation Index (courtesy of StockCharts.com), has followed the example of the SPX and has also surged past its 200-DMA. This is a lot of strength, and it raises the question of whether or not we are truly in a bear market rally! We shall soon find out!
In the meantime, the RSI is the most overbought that it has been in a year and is due for a correction..
Sentiment
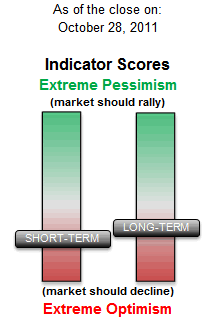
The SentimenTrader (courtesy of same) is finally showing some negativity, which is in line with other signs that we are approaching some sort of market top. Since we assume that prices should rise a little higher, it may even get more negative by the time we reach the top of the move.
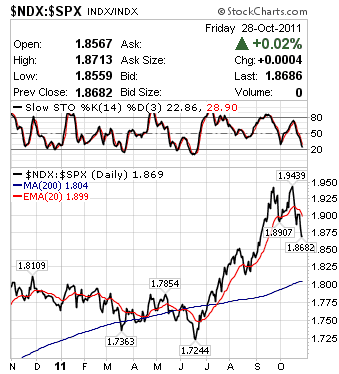
NDX:SPX
We have been waiting for the QQQ to lose its relative strength to the SPX, and it is now happening. This could be telling, especially if it continues.
VIX
Whenever there is a lack of clarity in the pattern that is being formed by the SPX, the VIX -- which trades inversely to the equity index - can often be relied upon to put the formation in better focus.
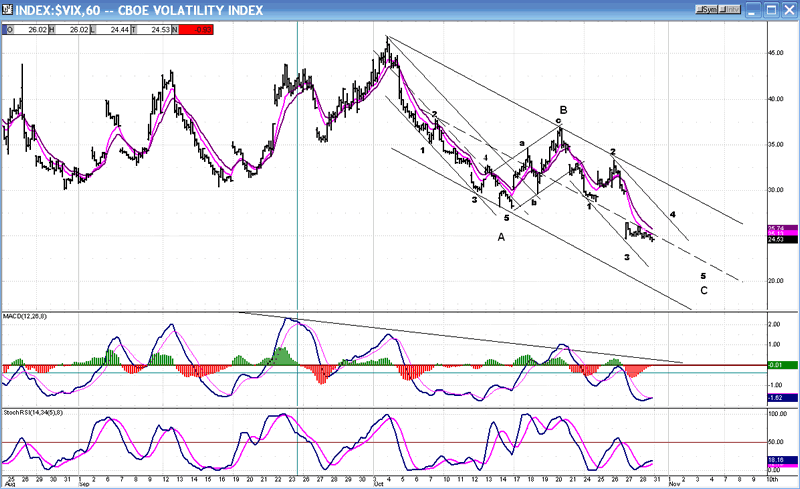
We have assumed that the SPX was making a zig-zag corrective pattern, but the "B" wave was not clear on the SPX. Is there any doubt left in our minds after looking at the VIX? Just like the SPX, the VIX needs a little more work in order to complete the corrective wave.
The P&F chart of the VIX (which closed at 24.53 Friday) gives a projection of 23 for the low of this move. That would correspond to 2310-20 in the SPX.
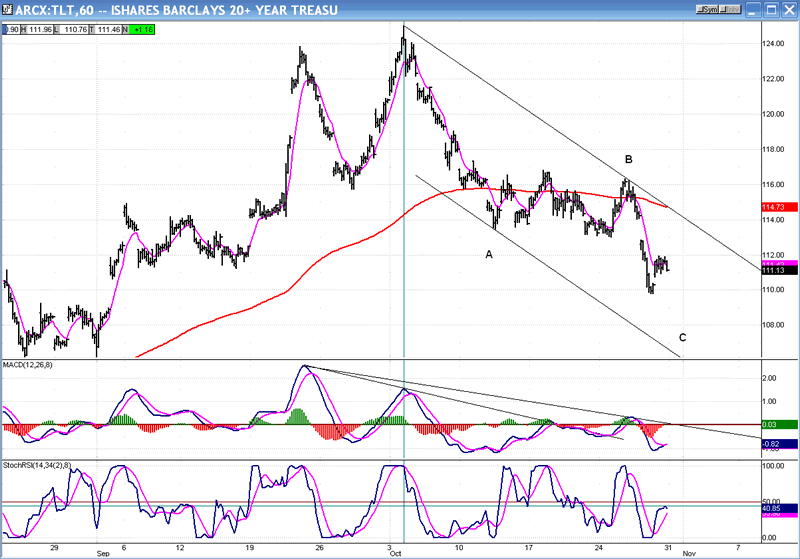
TLT
One more chart should convince us that the equity indices are just about ready for a correction. TLT is another index which has a price pattern that is inverted to that of the SPX. On this 60m chart, we see the same formation that we did on the VIX.
We also have a similar confirmation from the P&F chart. TLT closed at 111.46 on Friday. The P&F chart has a projection of 108-110, again matching the wave pattern which requires a little more downside work for completion.
Summary
Bulls should exercise caution over the next few days. I have cited many reasons why. There is every indication that we are nearing a reversal of the short-term trend. Will it also be the beginning of an intermediate trend in the opposite direction? This is something that we do not know at this time, and we must wait for the market to tell us. There has been so much bullishness that it may be difficult for the SPX to have a serious decline right away. Perhaps a period of sideways distribution will be needed, first.
FREE TRIAL SUBSCRIPTON
If precision in market timing for all time frames is something which is important to you, you should consider a trial subscription to my service. It is free, and you will have four weeks to evaluate its worth.
For a FREE 4-week trial. Send an email to: ajg@cybertrails.com
For further subscription options, payment plans, and for important general information, I encourage you to visit my website at www.marketurningpoints.com. It contains summaries of my background, my investment and trading strategies and my unique method of intra-day communication with Market Turning Points subscribers.
By Andre Gratian
MarketTurningPoints.com
A market advisory service should be evaluated on the basis of its forecasting accuracy and cost. At $25.00 per month, this service is probably the best all-around value. Two areas of analysis that are unmatched anywhere else -- cycles (from 2.5-wk to 18-years and longer) and accurate, coordinated Point & Figure and Fibonacci projections -- are combined with other methodologies to bring you weekly reports and frequent daily updates.
“By the Law of Periodical Repetition, everything which has happened once must happen again, and again, and again -- and not capriciously, but at regular periods, and each thing in its own period, not another’s, and each obeying its own law … The same Nature which delights in periodical repetition in the sky is the Nature which orders the affairs of the earth. Let us not underrate the value of that hint.” -- Mark Twain
You may also want to visit the Market Turning Points website to familiarize yourself with my philosophy and strategy.www.marketurningpoints.com
Disclaimer - The above comments about the financial markets are based purely on what I consider to be sound technical analysis principles uncompromised by fundamental considerations. They represent my own opinion and are not meant to be construed as trading or investment advice, but are offered as an analytical point of view which might be of interest to those who follow stock market cycles and technical analysis.
Andre Gratian Archive |
© 2005-2022 http://www.MarketOracle.co.uk - The Market Oracle is a FREE Daily Financial Markets Analysis & Forecasting online publication.