


Gold, Silver and Miners Technicals
Commodities / Gold & Silver Stocks Oct 21, 2011 - 09:15 AM GMTBy: Willem_Weytjens

 These days, a lot is going on in the world. All those events have a big impact on the price of Stocks, commodities, bonds,… Let’s have a look at the major trends in Gold, Silver and Mining stocks.
GLD touched the 150MA yesterday. In the past, this level often acted as support as we can see in the chart below:
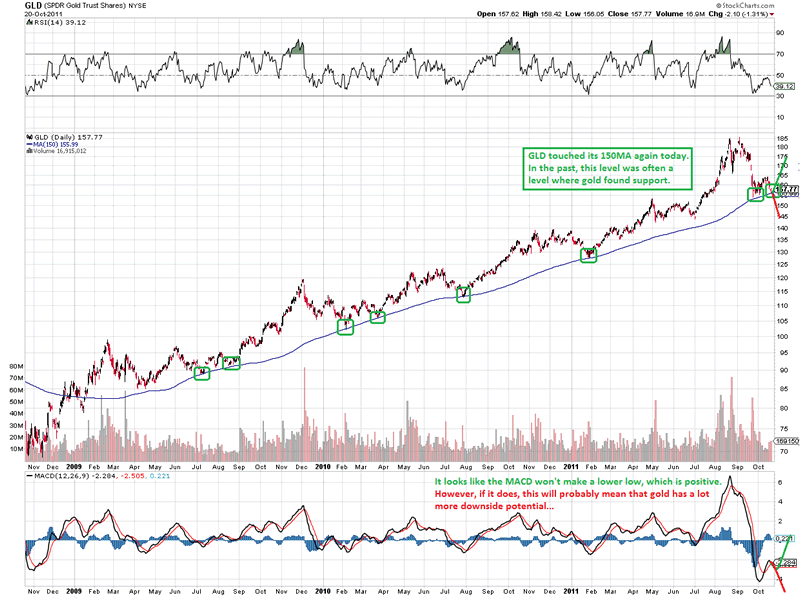
Chart courtesy stockcharts.com
GLD also tested the breakout above the green resistance line that was in place since 2008.
The weekly MACD also tested this green line:
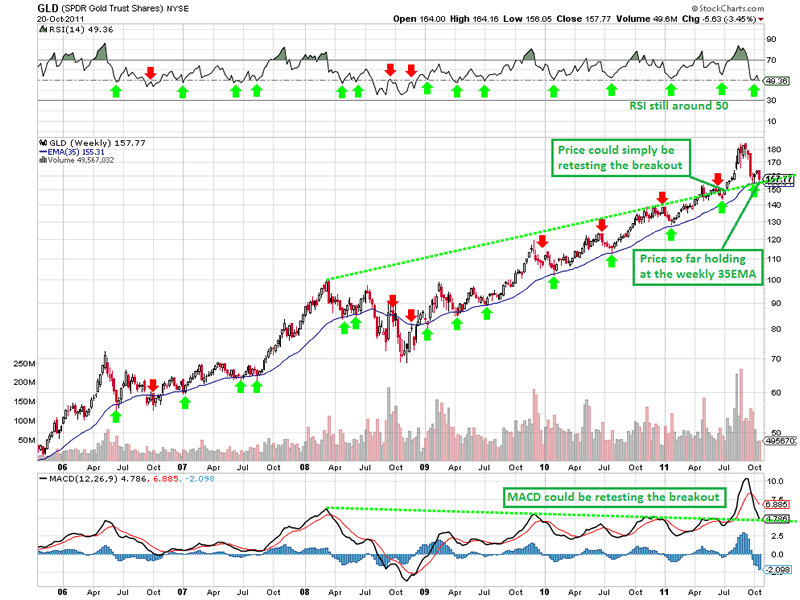
Chart courtesy stockcharts.com
When we look at ANV (Allied Nevada Gold), we can see that price hit the lower bollinger band yesterday, where it found support. Price managed to close slightly above the 220EMA, where it found support in the past. If price manages to move away from the lower Bollinger Band, this would be very Bullish. If it fails to do so, it would be very Bearish, and we would expect a waterfall decline.
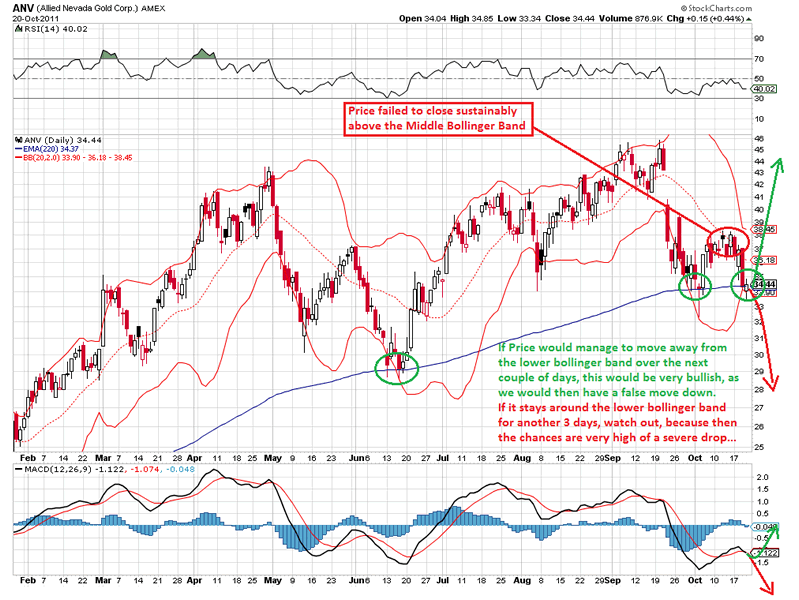
Chart courtesy stockcharts.com
The HUI index looks set to retest the green breakout line, which has been in place since 2008.
However, there is also a bearish Broadening Pattern in play, which, could lead to (much) lower prices:
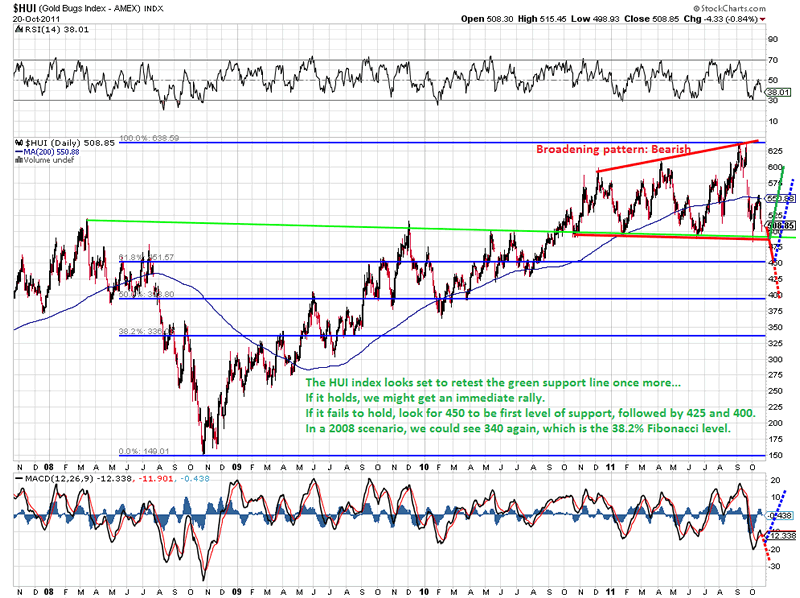
Chart courtesy stockcharts.com
Silver failed to close sustainably above the middle Bollinger Band (20MA), which is bearish. Support is to be found at the lower Bollinger Band, while resistance is to be found at the middle Bollinger Band, followed by the upper Bollinger Band, which is also last weeks highs around $31.5-$32. If price fails to close sustainably above the middle BB, look out below.
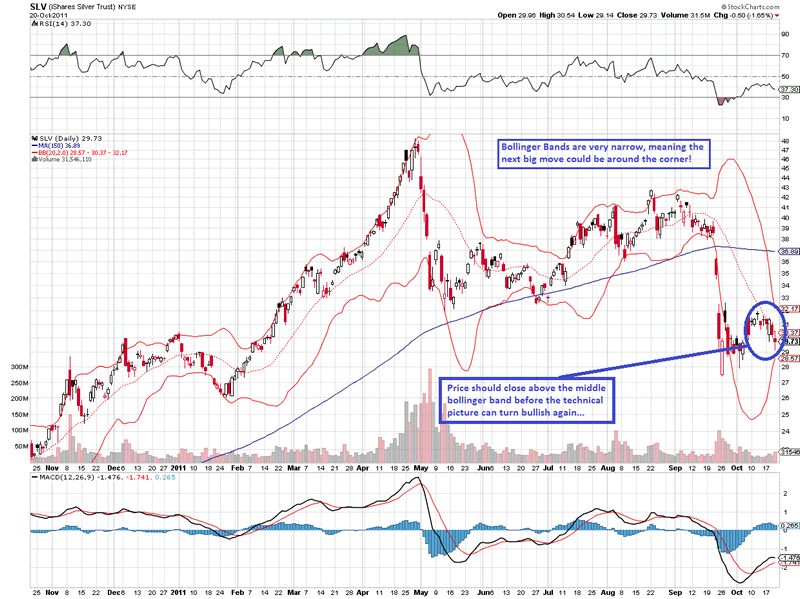
Chart courtesy stockcharts.com
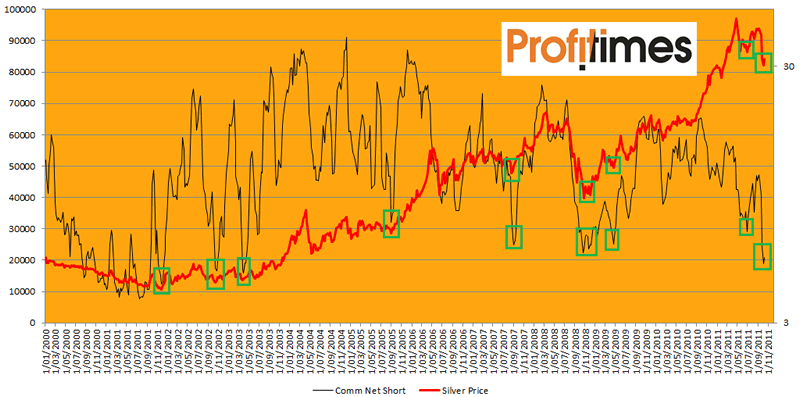
The COT reports for silver look very bullish, as the Commercials have cut their Net Short positions to Bull market low levels. I highlighted each low with a green square. Have a look at the Silver price following each square. everytime during this bull market, silver rallied when the Commercials’ Net Short Positions were this low.
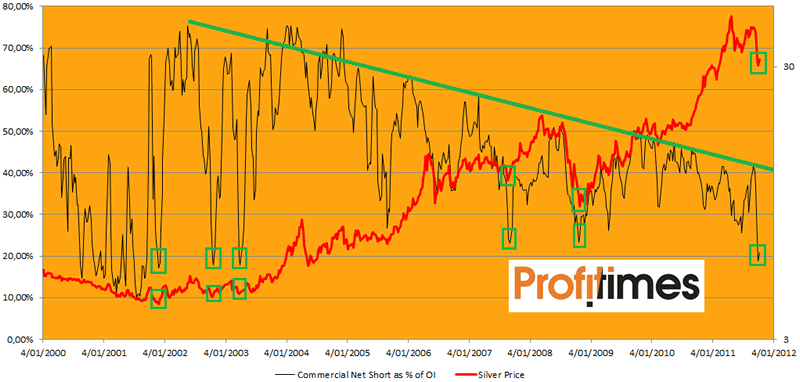
When we look at the Commercials’ Net Short Position as a % of Open Interest (CNSP%OI), we can notice that during the entire bull market, this % always kept setting lower highs. The CNSP%OI also reached bull market lows right now, confirming the findings in the chart above:
In my search for value, I came across this interesting chart (from April 2011) from Hubert Moolman:
This chart shows the JSE Gold Index versus the Gold price measured in South African Rand.
We can see that the JSE Gold Index is yet to break out to new highs after a decade long consolidation.
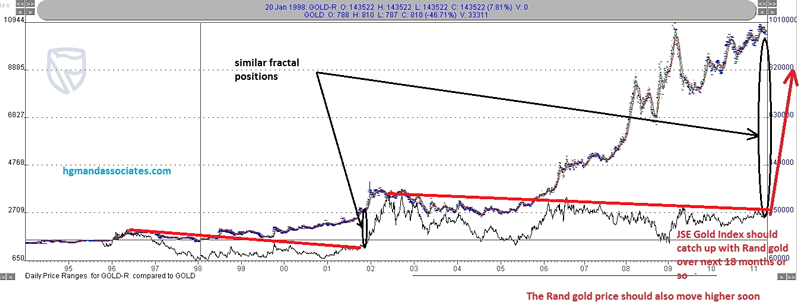
Chart courtesy Hubert Moolman
When I was looking for historical data for the JSE Gold Index, mr. Moolman was kind enough to tell me that Gold Fields (in South African Rand) is a good proxy for the JSE Gold Index, which appears to be true, as we can see in the chart below:
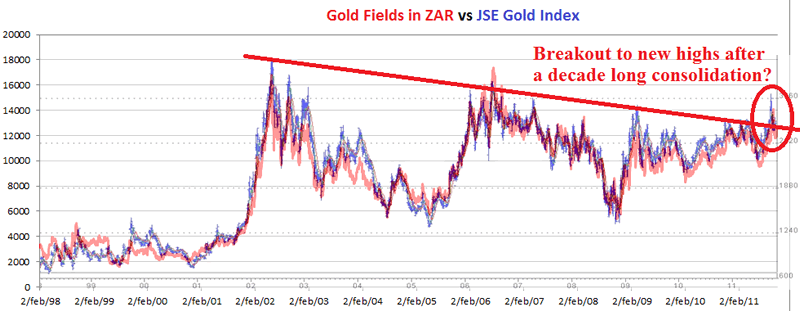
Are South African Miners about to skyrocket higher after nearly a decade long consolidation, despite higher Gold prices? Time will tell. They look ready to fly.
For more analyses and trading updates, please visit www.profitimes.com
Willem Weytjens
www.profitimes.com
© 2011 Copyright Willem Weytjens - All Rights Reserved
Disclaimer: The above is a matter of opinion provided for general information purposes only and is not intended as investment advice. Information and analysis above are derived from sources and utilising methods believed to be reliable, but we cannot accept responsibility for any losses you may incur as a result of this analysis. Individuals should consult with their personal financial advisors.
© 2005-2022 http://www.MarketOracle.co.uk - The Market Oracle is a FREE Daily Financial Markets Analysis & Forecasting online publication.