


Analyzing the Australian Dollar, Up, Down, and Under
Currencies / Austrailia Oct 20, 2011 - 02:38 AM GMTBy: Gary_Dorsch

 With the Sword of Damocles hanging over the Euro currency by a thread, many speculators in the foreign exchange markets are flocking to the currency Down Under – the Australian dollar, attracted to its free wheeling and dealing, and its heightened volatility. The Aussie dollar offers much higher interest rates than other Asian currencies, such as the Hong Kong dollar and Japanese yen, whose exchange rates are essentially fixed by their governments though daily market intervention, making the Aussie a favorite target for carry traders.
The Australian dollar is the fifth-most-actively traded currency in the foreign exchange markets behind the US-dollar, the Euro, Japan’s yen and the British pound. The Australian dollar now accounts for 7.5% of the turnover in the $4-trillion-a-day currency market, and it’s gaining popularity, because the Australian central bank keeps its intervention in the currency markets to a minimum. Most of all, its direction is linked to the commodity super cycle, and offers indirect exposure to the world’s fastest growing region in Asia, especially China.
Australia’s mining boom is largely fueled by Chinese demand, which has kept Australia’s economy out of recession for the past 20-years. “It is likely to be sustained for a very long period,” Prime Minister Julia Gillard said on October 3rd. “We are in a different economic phase and we shouldn’t let the language of boom deceive us. It is a boom, it is a huge opportunity for growth in our resource sector and great opportunities for jobs and wealth creation as a result, but it is likely to be sustained for a very long period of time,” Gillard said.
As is often the case with countries that rely on commodities for a sizable percentage of their exports, the direction of the Australian dollar is closely correlated to the gyrations of key commodity prices. Yet interestingly enough, Australia’s top-2 export earners, coal and iron ore aren’t included in the basket of commodities that are traded in the European or US exchanges. Still, Australia is blessed with wealth of natural resources that are in high demand, including crude oil, gold, grains, diamonds, iron ore, uranium, nickel and coal. Among the Group-of-20 countries, Australia stands out with mining, energy, and agricultural commodity exports accounting for around 12% of the GDP, but 60% of its total exports.
Generally speaking, sharply higher commodity prices can fuel strong inflationary pressures in most Emerging economies, and prod central banks to lift interest rates. At the same time, sharply higher commodity prices will zap the disposable income of consumers and whittle away at the profitability of producers in the developed nations, such as in Europe, Japan, and the United States. Yet the Australian economy usually looks healthier when commodity prices are rising. That positions the Australian dollar, dubbed the “Aussie,” as a popular alternative to the Euro, Japanese yen, British pound, and US-dollar for traders looking to go long on commodity exposure, while going short on currencies whose local companies are likely to suffer weaker profit margins due to higher input costs.
High prices for industrial commodities, especially base metals, iron ore, coal, and natural gas are now providing Australia with its largest trade surpluses in history. Australia posted a trade surplus of $3.1-billion in August, - the second highest on record. That brought the running 12-month total to a healthy A$22-billion. In particular, the industrialization and urbanization of billions in China and India is generating huge demand for coal and iron ore, Australia's two biggest exports. Over two-thirds of Australia’s exports now go to Asia, with China alone accounting for 26% of total exports, while the EU takes 7% and the US less than 4-percent.
Overall, Australia’s miners and farmers are tipped to drive export earnings to new heights this fiscal year, assuming that commodity prices can defy the doom and gloom in the global financial markets. Export receipts from mines, gas and oilfields will surge past the A$215-billion mark for the first time in 2011-12, with farms adding another A$35-billion to the export tally, despite the high local dollar. “The +21% increase in resources and energy export earnings reflects strong increases for most commodities, including coal, iron ore, crude oil and natural gas, base metals and gold,” the Bureau of Resources and Energy Economics said.
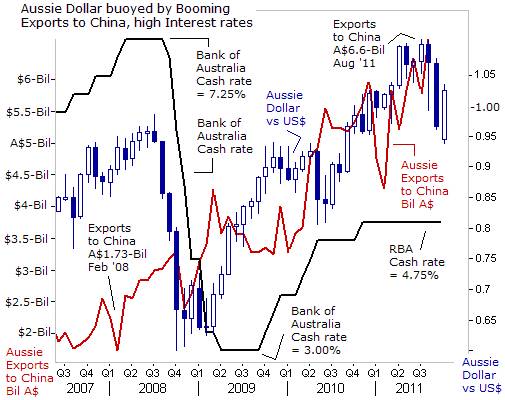
Chinese demand for commodities looks to have remained resilient in August, even as global stock markets nosedived. China’s imports from Australia rose almost +42% in August from a year earlier to a record $6.6-billion. China ran a trade deficit with Australia worth $4.3-billion for the month. That demand helped lift the RBA’s index of commodity prices to record peaks both July and August, having climbed +25% over the preceding 12-months. Exports to Japan were ahead +7% at nearly $5-billion, while shipments to Korea climbed +14% to more than $2 billion. For the 12-months to August, exports to East Asia rose +26%, with shipments to China reaching a cumulative A$64.8-billion, and up an astonishing �percent. Overall, Australian exports to China have increased 25-fold in real terms since 1990.
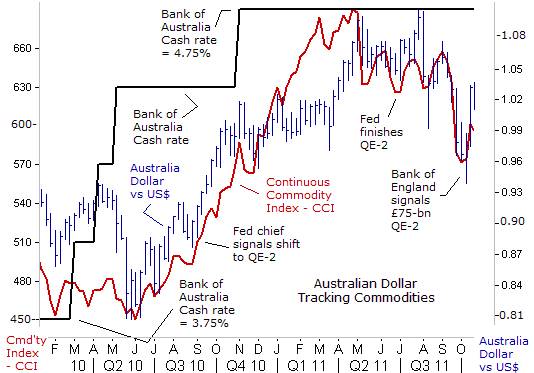
The boom in commodity exports helped to lift the Australian dollar above parity with the US-dollar on October 15th, 2010 for the first time since becoming a freely traded currency in 1983. The Aussie then traded above parity for several days in November. On May 2nd, 2011 the Australian Dollar hit a record high when it traded at a $1.1011 against the US Dollar. Seeking to head off inflationary pressures, the Reserve Bank of Australia (RBA) has kept its overnight cash rate locked at 4.75% for almost a year, a neutral level that neither stimulates nor retards economic growth, while a strong Aussie dollar also helps keep inflation in check.
Australia is also the world’s single-largest exporter of the iron ore. Roughly 62% of Australia’s exports to China are concentrated in sales of iron ore, and 7.5% in coking and thermal coal. Thus, roughly 70% of Australia’s total exports to China, - coal and iron ore, - are directly linked to China’s vast steelmaking industry, which produces half of the world’s steel output. To meet China’s voracious demand, the Australian Bureau of Agricultural and Natural Resources is projecting iron ore exports, the biggest earner, to jump +5% to 425-million tons in 2011, and could reach 600-million tons by 2016. Some of Australia’s biggest customers are Baoshan Iron & Steel, China’s biggest publicly traded steelmaker, Sumitomo Metal Industries, Japan’s third-largest steelmaker, and India’s Tata Steel.
Rio Tinto is the world’s #2 iron ore producer by volume after Vale. In the next five years, Rio plans to grow output by +50% to 333-million tons a year in Australia’s western Pilbara region, at a possible cost of more than $15-billion. Rio reported a first-half profit of $7.8-billion and declared it would step up its share buyback by $2-billion after a cash windfall from record commodity prices. Melbourne-based rival BHP Billiton produced Australia’s largest-ever annual corporate profit of $21.7-billion and operating cash flow of $30.1-billion.
Income from iron ore, BHP’s biggest division, rose a better than expected 122% to $13.3-billion last year, spurred by strong demand from Chinese steel producers. The story was the same in other divisions. Earnings from base metals soared +47% to $6.8-billion. Profits from oil grew +38% to $6.3-billion. BHP Billiton is also investing billions in new production capacity in iron ore and coal in Australia, and completed a $10-billion share buyback ahead of schedule. Fortescue Metals Group was also rewarded with a healthy profit courtesy of soaring iron ore prices and increased production, with a +76% jump in annual profit, to $US1-billion.
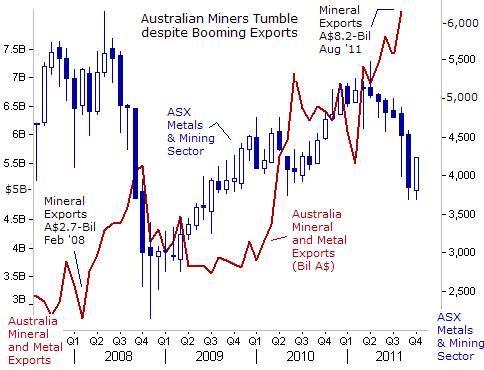
In fact, BHP Billiton’s $22-billion profit was equal to nearly a third of the total $71.4-billion in profits reported by Australia companies this earnings season. Throw in Commonwealth Bank’s $6.4-billion profit, and the two companies -- with a combined 20% index weighting -- produced 40% of the reported profits. However, despite all of these glowing results, the Australia Stock Exchange’s metal miners’ index has been sliding down a slippery slope, since April 11th and has lost as much as -31% of its market value.
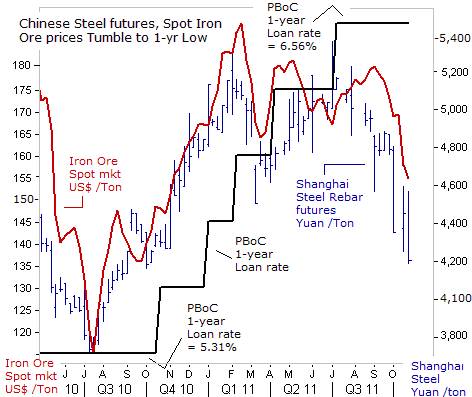
The selloff in Australian mining shares began to accelerate in July, and in sympathy, knocked the Aussie dollar from its high perch at $1.100 to below parity against the US$. Currency traders started to take notice of the most actively traded Steel rebar contract on the Shanghai Futures Exchange, which began tumbling from as high as 5,400-yuan /ton, to as low as 4,205 yuan /ton this week, after dropping more than -11% in September, its biggest monthly loss ever. Traders say that a construction boom in China that fuelled steel prices higher earlier in the year is starting to lose steam, as a result of tighter credit conditions.
Prices for iron ore, the key component in making steel, has also tumbled by more than -12% since August 28th, amid expectations that #1 buyer China might cut its steel output in the fourth quarter. Index-based spot iron ore prices, based on Chinese transactions and used by global miners in fixing supply contracts, slid to $153.45 /ton on October 17th, the lowest since March. Prices of forward swaps also extended losses, with the Singapore Exchange-cleared November contract falling more than $4 to $154.17 /ton.
Chinese steel output fell to 56.7-million tons in September, falling from a record high of 60.2-million tons in May. Although output in September was still +16.5% higher than the same period of last year, traders in Shanghai figure that steel output has reached a peak and expect further declines in the fourth quarter, normally a peak demand period, with steel mills impacted by a slowdown in the global economy as well as domestically.
Australia is also the world’s biggest exporter of coal, shipping about 316-million tons annually, and worth roughly A$46-billion in overseas sales last year. Australia’s coking coal exports are estimated at 164-million tons this year, equal to nearly 60% of the global total. China single-handedly produces about half of the world’s steel, and coking coal has quickly emerged as one of the handful of commodities in critical need by its steel sector. In 2009, China became a net importer of coal for the first time. It bought 104-million metric tons of coal, including both thermal coal - used to fire power plants for generating electricity, and coking coal. China’s coal imports for the first nine months of this year reached 120-million tons.
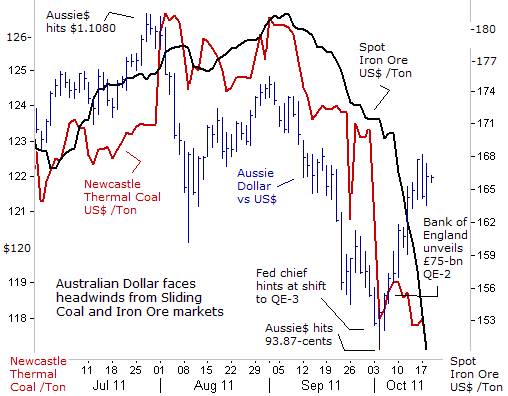
However, the price of thermal coal, accounting for about half of Australia’s coal exports, and in more abundant supply in China, is starting to slide alongside the stumbling price of iron ore. Fortescue Metals predicts iron ore prices are likely to continue sliding in the months ahead, even after the company released solid first-quarter results. Fortescue’s iron ore fetched an average price of $US160 /ton during the three months to September, but it now sees “softening steel prices and a tight monetary policy in China helping to bring iron ore prices down, and would continue to do so.” In a positive note for Fortescue, its costs of production were lowered to below $US50 /ton for the first time.
Thermal coal at Newcastle, Asia’s benchmark price, tumbled to $117.50 /ton this week. That’s down from a three-year high of $131.50 /ton last January, when floods inundated Australia’s state of Queensland. Indonesia’s coal output may rise 6% to a record 340-million tons this year, and supplies from Australia are expected to increase +12% to 135-million tons in 2012. Thus, traders now suspect that a small glut of thermal coal in Asia could start to develop.
Copper, the metal with a PH-D in Economics lost as much as a third of its value from its record high peak, since August 7th. On Oct 3rd, JP-Morgan reported that the Global Manufacturing PMI had contracted worldwide for the first time in over two years last month as incoming orders for new work dried up. Softening prices for industrial commodities are starting to take some of the wind out of the sails of the Australian dollar, and are presenting some formidable headwinds that are weighing on the Aussie’s exchange rate with the US-dollar.
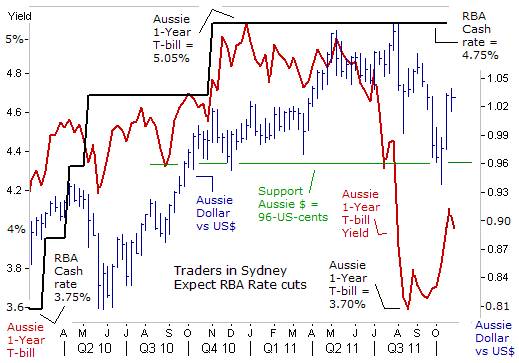
The Aussie dollar also faces stiff resistance on the interest rate front, although a rate cut by the RBA wouldn’t be taken as a big surprise by currency trades. The yield on Australia’s 1-year T-bill rate has dropped sharply since May 1st, and is last seen at 4.02%, or nearly three-quarters of a percent below the RBA’s overnight cash rate. Interbank futures on the ASX continue to imply a two-in-three chance of a 25-basis point rate cut to 4.50% before year’s end. The RBA seemed to open the door for a small rate cut, as early as next month in what would mark an about-face for the famously hawkish bank.
The RBA said in releasing the minutes of its October policy meeting that future decisions would depend largely on the outlook for domestic prices and on developments in the shaky global economy. “Members believed that an improved inflation outlook, if confirmed by further data, would increase the scope for monetary policy to provide some support to demand, should that prove necessary,” the RBA said. Much would depend on the inflation data for the third quarter, due on October 26th, falling back to within the RBA’s 2-3% inflation target band. The RBA said it expects Australia’s terms of trade to decline in the period ahead as global prices for commodity exports eased in response to softening demand in foreign economies.
Even a modest RBA cut in rates could give a sizable boost to incomes and provide a direct and rapid stimulus to the economy. There are A$1.2-trillion of home mortgages outstanding, and 95% of them are based upon variable rates, easily the highest share of any developed nation. This makes monetary policy a very powerful tool. For an average mortgage of A$300,000, a 25-basis points rate cut lowers the interest rate expense by A$600 a year.
Two quarter point rate cuts by the RBA, expected by Aussie T-bill traders could help cap the rise of the Australian dollar, and might level the local playing field for Australian companies competing in the global markets. Western Australia is home to the top miners, and 10% of the country’s population, yet is earning about 60% of the foreign income. The other 90% of Australians are earning 40% the foreign exchange. Manufacturing companies trying to win exports or fend off imports would get some relief from a slightly weaker Australian dollar.
This article is just the Tip of the Iceberg of what’s available in the Global Money Trends newsletter. Subscribe to the Global Money Trends newsletter, for insightful analysis and predictions of (1) top stock markets around the world, (2) Commodities such as crude oil, copper, gold, silver, and grains, (3) Foreign currencies (4) Libor interest rates and global bond markets (5) Central banker "Jawboning" and Intervention techniques that move markets.
By Gary Dorsch,
Editor, Global Money Trends newsletter
http://www.sirchartsalot.com
GMT filters important news and information into (1) bullet-point, easy to understand analysis, (2) featuring "Inter-Market Technical Analysis" that visually displays the dynamic inter-relationships between foreign currencies, commodities, interest rates and the stock markets from a dozen key countries around the world. Also included are (3) charts of key economic statistics of foreign countries that move markets.
Subscribers can also listen to bi-weekly Audio Broadcasts, with the latest news on global markets, and view our updated model portfolio 2008. To order a subscription to Global Money Trends, click on the hyperlink below, http://www.sirchartsalot.com/newsletters.php or call toll free to order, Sunday thru Thursday, 8 am to 9 pm EST, and on Friday 8 am to 5 pm, at 866-553-1007. Outside the call 561-367-1007.
Mr Dorsch worked on the trading floor of the Chicago Mercantile Exchange for nine years as the chief Financial Futures Analyst for three clearing firms, Oppenheimer Rouse Futures Inc, GH Miller and Company, and a commodity fund at the LNS Financial Group.
As a transactional broker for Charles Schwab's Global Investment Services department, Mr Dorsch handled thousands of customer trades in 45 stock exchanges around the world, including Australia, Canada, Japan, Hong Kong, the Euro zone, London, Toronto, South Africa, Mexico, and New Zealand, and Canadian oil trusts, ADR's and Exchange Traded Funds.
He wrote a weekly newsletter from 2000 thru September 2005 called, "Foreign Currency Trends" for Charles Schwab's Global Investment department, featuring inter-market technical analysis, to understand the dynamic inter-relationships between the foreign exchange, global bond and stock markets, and key industrial commodities.
Copyright © 2005-2011 SirChartsAlot, Inc. All rights reserved.
Disclaimer: SirChartsAlot.com's analysis and insights are based upon data gathered by it from various sources believed to be reliable, complete and accurate. However, no guarantee is made by SirChartsAlot.com as to the reliability, completeness and accuracy of the data so analyzed. SirChartsAlot.com is in the business of gathering information, analyzing it and disseminating the analysis for informational and educational purposes only. SirChartsAlot.com attempts to analyze trends, not make recommendations. All statements and expressions are the opinion of SirChartsAlot.com and are not meant to be investment advice or solicitation or recommendation to establish market positions. Our opinions are subject to change without notice. SirChartsAlot.com strongly advises readers to conduct thorough research relevant to decisions and verify facts from various independent sources.
Gary Dorsch Archive |
© 2005-2022 http://www.MarketOracle.co.uk - The Market Oracle is a FREE Daily Financial Markets Analysis & Forecasting online publication.