Dow Theory Stocks Primary Bear Market Confirmation
Stock-Markets / Dow Theory Dec 16, 2007 - 10:56 AM GMTBy: Tim_Wood
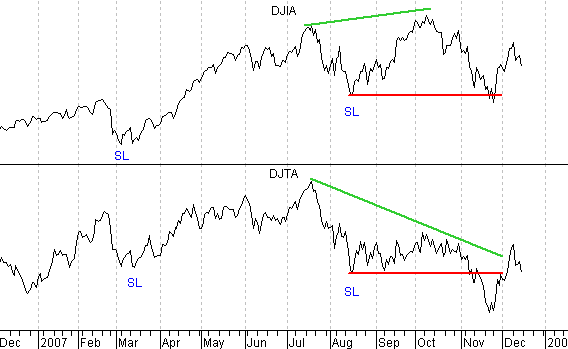
 The primary bear market confirmation that occurred on November 21 st when the Industrials confirmed the Transport's break below the August closing low remains in place in spite of the recent rally. In fact, the rally that began out of the November 26th low was anticipated and I stated before this rally began that it was going to cause many to question the integrity surrounding the November 21st Dow Theory primary bear market confirmation. That has definitely proven correct.
Robert Rhea, who was the leading Dow theorist in the late 1920's and 1930's stated: “Charles H. Dow never intended his theory of price movements to be construed as being a method whereby the royal road to riches could be found. While the principles laid down by him and developed by William Peter Hamilton may assist us in understanding something of security price trends, it would nevertheless be a fallacy to undertake any discussion of the subject without making the point very clear that no dependable method of beating the market has yet been discovered. Intelligent observation and study of the ever-recurring formations in the averages which Dow and Hamilton noted can, however, prove invaluable to both investors and speculators.”
In reading the volumes of original writings on Dow theory I totally agree. Though not infallible, Dow's read of the averages were meant to be a “Barometer” for gauging future finance and business conditions and one of the very basic concepts of Dow's theory is that the averages look ahead and discounted everything. Hamilton wrote “The fluctuations of the daily closing prices of the Dow Jones rail and industrial averages afford a composite index of all the hopes, disappointments, and knowledge of everyone who knows anything of financial matters, and for that reason the effects of coming events (excluding acts of God) are always properly discounted in their movement.”
As an example of this, the non-confirmation that was formed between the averages in October and that can be seen in the chart below warned that something was wrong in accordance to Dow theory. That non-confirmation then evolved into a full-blown primary trend change on November 21, 2007. As I read the averages the last primary bearish trend change in which the averages forecasted stormy conditions occurred on February 25, 2000 and following that confirmed primary trend change the Industrials ultimately fell by over 27% from that date and by over 37% from their January 2000 closing high. According to Richard Russell's read of the Dow theory at that time, the primary trend change occurred on September 23, 1999, which was prior to a final unconfirmed push to new highs by the Industrials. In either case, regardless of whether the last bearish primary trend change occurred on September 23, 1999 or on February 25, 2000, the outcome ultimately ended very badly.

As for the current case, it is my read that a primary trend change occurred on November 21, 2007 and I have spoken with Richard Russell in regard to this matter and he too agrees with this assessment. In my December newsletter I examined every primary bearish primary trend change since 1896. I cannot share all of these details here, but I will tell you that of the 30 previous bearish primary trend changes only 3 were “false.” When I say false, I mean that nothing material develop following the trend change. However, the remaining 27 primary bearish tend changes were meaningful. Thus, history has proven that 90% of the primary bearish trend changes since 1896 were indeed worth respecting. I for one will not bet against 90% odds.
Now I want to look at a couple of other non-confirmations that have absolutely nothing to do with Dow theory, but which do serve as an indication that the Dow theory is correct in its current assessment of poor future business conditions. First, we have a chart of the Retailers verse the Industrials. As you can see, the Retailers topped in early June and completed a double top in July. From that point the retailers fell into their August low along with the Industrials. But, as the Industrials moved up into their October high, the Retailers, like the Transports, failed to confirm that advance. So, it is logical that with the Retailers lagging so would the Transports. After all, if the goods aren't being sold, then they aren't being shipped. Thus, the Retailers and the Transports non-confirmation of the Industrials is indeed a sign that business conditions are cloudy just as Dow's theory currently suggests.
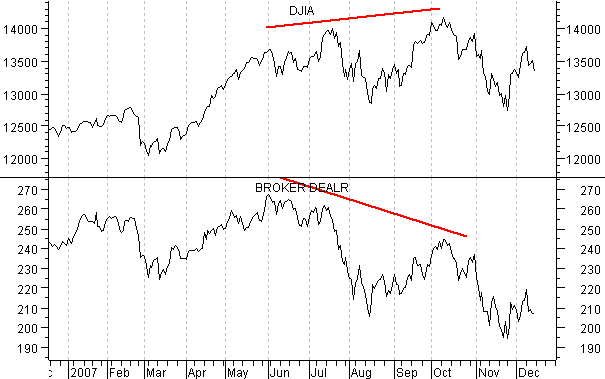
In the next chart below I have included the Broker Dealer Index verses the Industrials. The Broker Dealer Index serves as an indicator for the brokerage industry and includes companies such as Ameritrade, Charles Schwab, Lehman Brothers, Bear Stearns, Morgan Stanley, A G Edwards, Merrill, Raymond James, Legg Mason and Goldman Sachs. In this case both averages were in gear to the upside until early June 2007 when the Broker Dealer Index peaked. Following the June peak in the Industrials, both of these averages again moved into the August lows. But again, from these August lows the Broker Dealer Index failed to confirm the Industrials and once the rollover from the October high began, both averages moved below their previous lows, which again served to establish the trend as being down. Point here is that the Broker Dealer Index is also currently confirming the cloudy finance and business conditions.

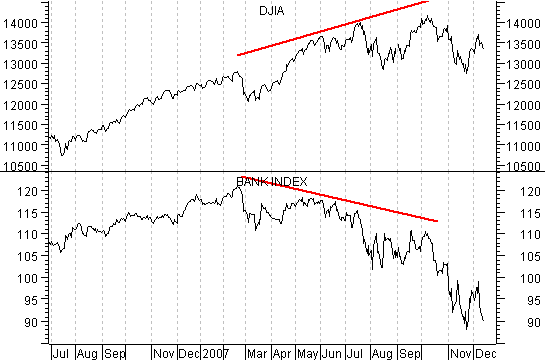
But wait, let's look at yet another important sector. Let's look at banking. In the chart below I have included a chart of the Banking Index verse the Industrials. In this case the Banking Index topped out in February 2007 well ahead of the Industrials and likely in anticipation of the ongoing credit crisis that has been by-and-large swept under the rug. In any event, the Banking Index is now back at its 2003 levels and certainly has not confirmed the Industrials. Thus, here too we have yet another important sector that has also been looking ahead and forecasting cloudy business conditions.

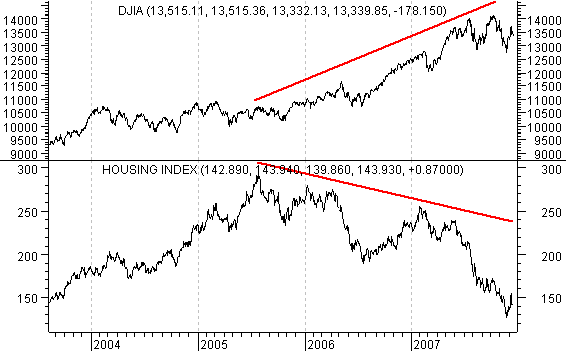
Next, I have included housing. I publicly warned in October 2005 that housing was at risk of topping. In subsequent articles I confirmed that top and I last showed here way back in April how housing tends to lead at important 4-year cycle tops in the equity markets. In the chart below I have included the Housing Index verses the Industrials. Here you can see the 2005 top that I first warned about over 2 years ago and for the record, the Housing Index is also back to its 2003 levels.

Now, think about something for a minute. The housing market has clearly lead the way down. This downturn in housing was followed by a severe downturn in the Banking Index, which has further evolved into another rate cutting cycle in which the Fed is being forced to cut interest rates. This obviously weak back drop for business has since been followed by a weakening of the Retailers, which has lead to a weakening of the Transports, which ultimately lead to a Dow theory non-confirmation and more recently a bearish primary trend change. To say this another way, does it make since for the Industrials to be at or near all time highs with virtually the rest of the financial world coming unraveled?
It appears relatively clear cut through my eyes that the November 21 st Dow theory primary trend change is indeed signaling stormy business conditions just as Charles H. Dow suggested over 100 years ago. It is also relatively clear by the other non-confirmations discussed above that the Dow theory is once again more likely than not to also be correct this time around. This past Thursday Alan Greenspan raised the odds of a recession from 30 to 50 percent. It is my opinion we are already in a recession and the Dow theory is confirming it. Of course it seems that few believe the Dow theory. In any event, you have been warned.
I have begun doing free Friday market commentary that is available at www.cyclesman.com/Articles.htm so please begin joining me there. In the December issue of Cycles News & Views I reviewed all Primary Bear markets going back to 1896 in an effort to answer the question of how far this decline could potentially go. I also have a very detailed slide show presentation on cycle quantifications, which gives a statistical analysis surrounding the overdone 4-year cycle that I have been warning about as well. A subscription includes access to the monthly issues of Cycles News & Views, which included Dow theory, a very detailed statistical based analysis covering not only the stock market, but the dollar, bonds, gold, silver, oil and gasoline along with short-term updates 3 times a week.
By Tim Wood
Cyclesman.com
© 2007 Cycles News & Views; All Rights Reserved
Tim Wood specialises in Dow Theory and Cycles Analysis - Should you be interested in analysis that provides intermediate-term turn points utilizing the Cycle Turn Indicator as well as coverage on the Dow theory, other price quantification methods and all the statistical data surrounding the 4-year cycle, then please visit www.cyclesman.com for more details. A subscription includes access to the monthly issues of Cycles News & Views covering the stock market, the dollar, bonds and gold. I also cover other areas of interest at important turn points such as gasoline, oil, silver, the XAU and recently I have even covered corn. I also provide updates 3 times a week plus additional weekend updates on the Cycle Turn Indicator on most all areas of concern. I also give specific expectations for turn points of the short, intermediate and longer-term cycles based on historical quantification.
Tim Wood Archive |
© 2005-2022 http://www.MarketOracle.co.uk - The Market Oracle is a FREE Daily Financial Markets Analysis & Forecasting online publication.


