


Stock Market Update: Stop the Insanity!
Stock-Markets / Elliott Wave Theory Dec 16, 2007 - 10:31 AM GMTBy: Dominick
 After a rollercoaster week, the S&P closed Friday on the lows of the week with a head and shoulders pattern looming in the 15-minute and hourly charts. Monday morning will have to decide if this bearish pattern gets played out, but it's also up against our bullish setup, so only the trader prepared for either outcome is truly prepared!
Remember we've continued to expect a Santa Claus rally to new highs that could very well extend months into 2008. While it seems most of the Street has declared the top is in, I don't think so and won't change my mind until I'm proven wrong. At the same time, I don't have members looking to create a buy and hold strategy as the markets need their corrective moves. Since the Fed's announcement this week, the pattern has been down and we've had no problem trading in that direction.
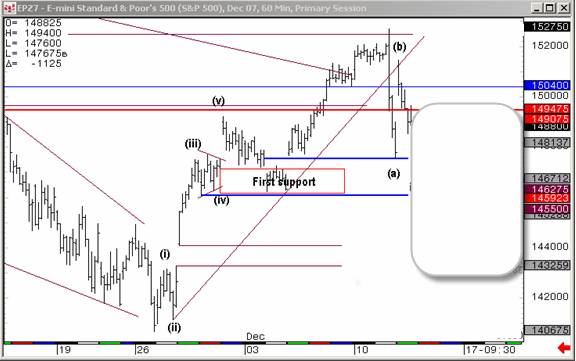
The chart above was posted Friday showing a corrective pattern off the recent highs that can explode higher, but which nonetheless requires further downside in the immediate term. This bullish setup is still valid and I don't want to be short when the real year-end rally kicks into high gear. It used to be you might see a 50 point move in a few weeks. But this is a market that's shown it can move 50 points in two hours – this is not your father's Oldsmobile!
Those who are out there position trading like their fathers taught them must really be struggling this year, and I feel for them. The market's been rangebound since June, almost six months now, and they're not getting anywhere. Different times call for a different approach, which is why it's so important for us to have not just Elliott wave and a host of proprietary targets and indicators on our side, but an unbiased mentality that lets us get in and out of positions on both sides of the markets as necessary. That's been our secret to making money this year.
Like we said last week, there was probably going to be a few more boring days ahead of the Fed meeting. Monday and Tuesday were sideways to slightly up into the policy statement and any keen Elliott wave trader should have known what to expect next – not because of the news or the fundamentals, but because of the target at 1533. The chart above was posted Monday showing a basic triangle pattern unfolding in the S&P futures that even a beginner should have been able to identify. Ultimately the Fed triggered the selloff that Elliott expected just six points shy of the perfect number, but that's a relatively small margin given the 120 points we'd advanced since finding that target area at the area labeled “c”.
The triangle pattern is one of the three we've been following in our updates, but it's now becoming a crowded trade since, as I said, even a beginner should be able to see it. I think the market might use either of our other two remaining patterns to finish things off, or do a shakeout early in the week.
But the point is that as the selling began, we were prepared to accept the move up was done. The decline was awesome for short term traders as the market reversed off the announcement highs and declined 50 points just before the bell stopped the hemorrhaging. The selling looked way overdone going into close and I mentioned in chat that the market was looking ripe for a long side flip with 1489-94 as a target.
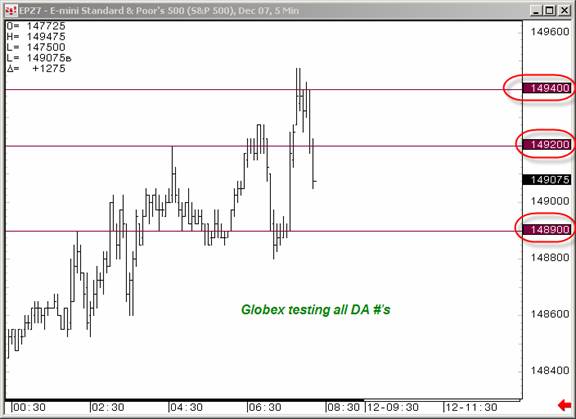
As you can see from the chart above, the market toyed with our range in the globex pre-opening hours. Selling the open would have made perfect sense, except for the fact that Bernanke and Co. decided to drop a bombshell and absolutely murder the shorts. As a result, we got a move beyond 1494 that was entirely artificial and based on the massive short squeeze sparked by the auction announcement. I actually felt bad for anyone short that morning because it was perfectly reasonable to try a short pre-market and to expect a three-wave correction to unfold.
As it turned out, this was one of those cases where being a little nimble and trading the b wave was lucky and you could have ridden the move as it extended well beyond where it should ended have technically. It's almost as if Bernanke had learned a little Elliott wave or maybe even gotten a call from Santa Claus asking him to speed up the b wave so we could get through with the correction and bring on the year-end rally on time.
But ultimately, all the pain for the short just led to more pain as the market melted and collapsed back into the gap. On seeing the insanity unleashed in the markets by the Fed's clumsy footing I commented in chat about the initial wild response to the August surprise cut ending badly with a market melting down and then selling off despite an initial 20 point pop. I posted in chat that I didn't trust the move and did not want to chase it only to get caught in a selloff. Sure enough, pain piled on top of more pain as traders systematically shuffled towards the exits in what can only be interpreted as a vote of no confidence in a Fed that would wreak such havoc with the balance sheets.
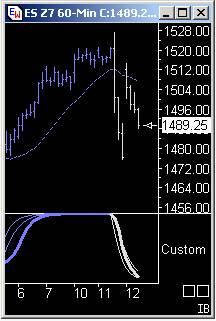
My takeaway from the whole Fed fiasco is again to trade the charts, not the news, not the Fed, not anything else. I joked many times that day that Bernanke was better off having a TTC membership which would have stopped him from making that announcement as our Proprietary 60 min trend chart was screaming to the downside.
 For all the madness, the Fed's bungling delivered exactly what we were looking for: a three-wave correction. Predictably, many tried to call the bottom on Thursday, but a fair reading of the charts said we must go lower. Again, this is not to say that the outlook is getting bearish yet, because I don't see that at this time, it's just that you have to allow the correction the room to play out as it needs. Friday's action looked perky, looked like it wanted to go higher, but no, we closed on the lows because that's what the charts said we needed to do.
As mentioned, the week closed with an obvious bearish head and shoulders pattern staring us in the face and we won't ignore it, but at the same time we won't put aside the bullish count that says we need to reverse and rally somewhere between here and the next forty points or so. If I'm right and we do get that reversal, that's going to be the big Santa Claus rally that takes us to new highs by early 2008 and I sure as anything don't want to be short when that happens! It would be nice if we can see some bad news hit the market as we approach those lows. Yes, bad news. As we wait for this decline, rest assured that any upwards movement that I can label impulsively from here will have me chase to the upside as others wait below. Either way, we have triggers in place and await the market's hidden message, which we know we can read.
Last week described how TTC looks to other clearly trending markets to keep us busy on slow days in the S&P, like early last week and on Friday. One of the big ones going forward is going to be the euro because in the face of all those trash-talkers saying the dollar's going to zero, we've seen the greenback come back to life recently, sending the euro lower. We may be seeing a short term low here soon if not already since I expect there's a good chance the real fireworks will be on hold until after the new year. Similarly gold may be due for some upside as it rounds the bottom of its unfolding triangle pattern waiting for a possible new high before facing some real pressure in January. Look at Joe's Precious Points for more on precious metals. Finally, soybeans could be our short of the year for 2008, as hinted at last week. We don't see an entry at this point, so we leave it to speculators to chase the tail end of this move, but we're interested in the next 300 point move, and it's not to the upside! Can anyone say lock limit?
Fee Increase
Last, but not least, if you haven't heard, TTC is going to raise it's ridiculously low monthly fee in February of next year and then close its doors to all but new institutional members. With the cooperation of seasoned analysts and traders, 2007 was an amazing year for TTC and its members – and next year will only get better! If you want to trade alongside professionals day in and day out, you can reserve your seat now for only $89/month.
Free Trial
Many new members discover that they can cancel some of their other subscriptions once they join TTC and that the move actually ends up saving them money on fees. Still, we want to give you the chance to see for yourself with no risk, which is why we're offering what may be one of our final free trial membership period this week. Subscribe by December 20 and stay for 7 days with full access to charts, chat and all TTC member privileges. At the end of your trial, if you're not satisfied, simply send me an email and I'll give you a full refund, no strings attached. It's that simple! There's no better value on the web than TTC and now there's no reason not to check it out for yourself. Click here to register for your free trial!
Have a profitable and safe week trading, and remember:
“Unbiased Elliott Wave works!”
By Dominick
www.tradingthecharts.com
If you've enjoyed this article, signup for Market Updates , our monthly newsletter, and, for more immediate analysis and market reaction, view my work and the charts exchanged between our seasoned traders in TradingtheCharts forum . Continued success has inspired expansion of the “open access to non subscribers” forums, and our Market Advisory members and I have agreed to post our work in these forums periodically. Explore services from Wall Street's best, including Jim Curry, Tim Ords, Glen Neely, Richard Rhodes, Andre Gratian, Bob Carver, Eric Hadik, Chartsedge, Elliott today, Stock Barometer, Harry Boxer, Mike Paulenoff and others. Try them all, subscribe to the ones that suit your style, and accelerate your trading profits! These forums are on the top of the homepage at Trading the Charts. Market analysts are always welcome to contribute to the Forum or newsletter. Email me @ Dominick@tradingthecharts.com if you have any interest.
This update is provided as general information and is not an investment recommendation. TTC accepts no liability whatsoever for any losses resulting from action taken based on the contents of its charts, commentaries, or price data. Securities and commodities markets involve inherent risk and not all positions are suitable for each individual. Check with your licensed financial advisor or broker prior to taking any action.
Dominick Archive |
© 2005-2022 http://www.MarketOracle.co.uk - The Market Oracle is a FREE Daily Financial Markets Analysis & Forecasting online publication.