


Silver’s Signals Lean Bearish For Stocks and Commodities
Stock-Markets / Financial Markets 2011 Oct 14, 2011 - 01:37 PM GMTBy: Chris_Ciovacco

 Before we review current bull/bear signals from silver, Bloomberg had an on the money comment relative to the efforts in Europe:
“Recapitalizing the banks is not the solution,” said Justin Bisseker, who helps manage 205 billion pounds as a European bank analyst in London for Schroders, Britain’s largest independent money manager. “Sovereign risk is the principal concern. Once investors’ confidence in sovereigns returns, then confidence in the banks will follow.&rM.
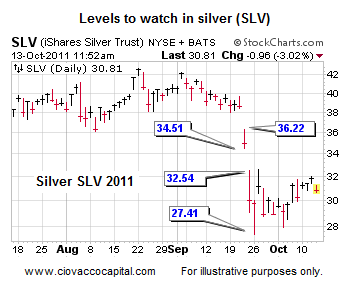
You do not need to know anything about technical analysis to conclude the two charts below of the silver ETF (SLV) look similar in many ways. The first chart is from August 2008 and the second from the present day (compare points A through H).
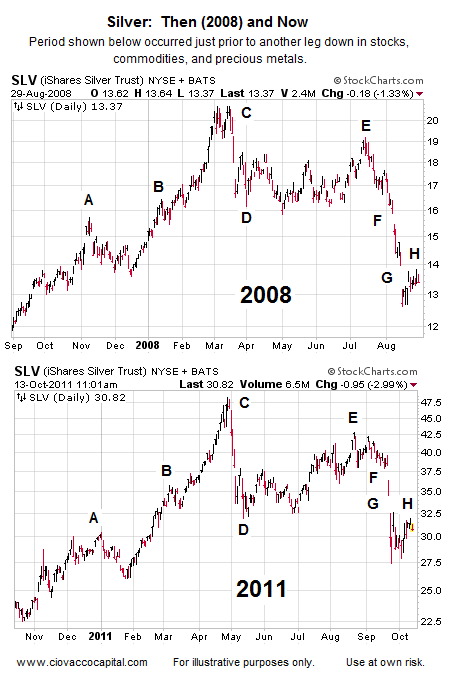
How can these charts help us with stocks, commodities, and precious metals? Silver tends to be in greater demand when (a) the economy is expected to grow, and (b) when inflation expectations are high. According to the Silver Institute:
Silver has a number of unique properties including its strength, malleability and ductility, its electrical and thermal conductivity, its sensitivity to and high reflectance of light and the ability to endure extreme temperature ranges. Silver’s unique properties restrict its substitution in most applications.
When silver is weak it is logical to question (a) the expectations for future economic growth, and (b) if investors are concerned about future inflation. If inflation is not a concern, then deflation fears are most likely increasing.
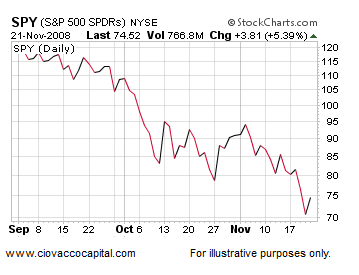
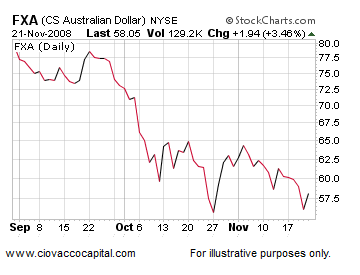
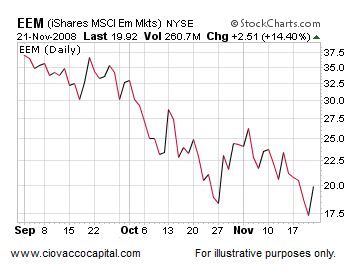
If we assume silver continues to trace out a similar path to what transpired in 2008, which may or may not happen, what are the possible implications for stocks, bonds, currencies, commodities, and precious metals? The first silver chart above shows the period September 29, 2007 through August 29, 2008. The charts below show asset class performance from August 29, 2008 through November 21, 2008, allowing us to answer the question, “What happened next in the 2008 deflationary period?” The key for the charts below: (SPY) S&P 500, (EEM) emerging markets, (FXA) Australian dollar, (UUP) U.S. Dollar Index, (DIA) Dow, (DVY) dividend stocks, (TLT) Treasuries, (SH) short S&P 500, (GDX) gold stocks, (GLD) gold, (SLV) silver, (DBC) commodities, (DBA) agriculture, (EWG) Germany, (PFF) preferred stocks, (XLU) utilities, (XLP) consumer staples, (XLY) consumer descretionary, and (JJC) copper. Symbols and descriptions are shown in the upper-left corner of each chart below.
What happened next in 2008?
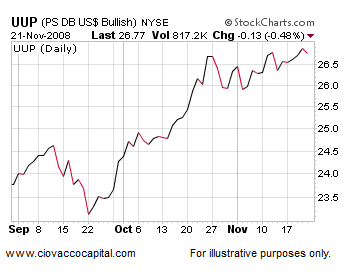
If the silver ETF can fill the gap in the chart below (between 32.54 and 34.51), it increases the odds of bullish outcomes for stocks and commodities. The longer SLV can hold above 32.54 the better for the bulls. If SLV fails to clear 32.54, the odds increase of an August 2008 scenario occurring again, similar to the outcomes shown in the charts above. An intraday move in SLV below 27.41, and more importantly, a weekly close below 27.41, increases the odds the deflationary trio of shorts (SH), the dollar (UUP), and bonds (TLT) will perform well.
Other bull/bear considerations beyond silver:
- On October 7, we outlined the case for a strong bear market rally similar to March 2008 - May 2008. The bullish set-ups in this video still need to be respected.
- On October 11, we showed how weekly moving averages have served as a bull/bear market demarcation line since the late 1990s. This video outlines the case for sellers to become active between 1,209 and 1,260 on the S&P 500. The strongest resistance lies between 1,209 and 1,249. While not highly probable, a case can also be made for a rally back to 1,260ish (neckline of head-and-shoulders pattern).
The markets may be underestimating the challenges and dollar amounts that lie ahead in Europe relative to bank recapitalizations. We mentioned on October 5 a quick fix in Europe is a tall order. Below are comments from the Wall Street Journal relative to the first bailout (Dexia):
Dexia’s French operations needed more liquidity than they could access, and over the weekend the governments of France, Belgium and Luxembourg agreed to break up the bank and either nationalize or attempt to sell off the assets. That’s going to be expensive: Belgium’s promised portion of the funding guarantee alone will leave its taxpayers on the hook for the equivalent of 15% of gross domestic product, on top of their existing government debt of 96.6% of GDP.
As of this writing, we continue to give the bearish/deflationary case the benefit of the doubt, understanding strong and gut-wrenching countertrend rallies are part of any bear market. Our portfolios continue to contain a mix of cash, shorts (SH), bonds (TLT), and the dollar (UUP). The deflationary/bearish case will take a hit if the S&P 500 trades between 1,250 and 1,260 for more than three or four days. The past two bear markets (tech bust and mortgage crisis) were primarily set in motion by events in the United States. Since the current state of affairs is primarily linked to Europe, the S&P 500 could surprise on the upside for a few months, although that remains a relatively low probability outcome.
-
Copyright (C) 2011 Ciovacco Capital Management, LLC All Rights Reserved.
Chris Ciovacco is the Chief Investment Officer for Ciovacco Capital Management, LLC. More on the web at www.ciovaccocapital.com
Ciovacco Capital Management, LLC is an independent money management firm based in Atlanta, Georgia. As a registered investment advisor, CCM helps individual investors, large & small; achieve improved investment results via independent research and globally diversified investment portfolios. Since we are a fee-based firm, our only objective is to help you protect and grow your assets. Our long-term, theme-oriented, buy-and-hold approach allows for portfolio rebalancing from time to time to adjust to new opportunities or changing market conditions. When looking at money managers in Atlanta, take a hard look at CCM.
All material presented herein is believed to be reliable but we cannot attest to its accuracy. Investment recommendations may change and readers are urged to check with their investment counselors and tax advisors before making any investment decisions. Opinions expressed in these reports may change without prior notice. This memorandum is based on information available to the public. No representation is made that it is accurate or complete. This memorandum is not an offer to buy or sell or a solicitation of an offer to buy or sell the securities mentioned. The investments discussed or recommended in this report may be unsuitable for investors depending on their specific investment objectives and financial position. Past performance is not necessarily a guide to future performance. The price or value of the investments to which this report relates, either directly or indirectly, may fall or rise against the interest of investors. All prices and yields contained in this report are subject to change without notice. This information is based on hypothetical assumptions and is intended for illustrative purposes only. THERE ARE NO WARRANTIES, EXPRESSED OR IMPLIED, AS TO ACCURACY, COMPLETENESS, OR RESULTS OBTAINED FROM ANY INFORMATION CONTAINED IN THIS ARTICLE. PAST PERFORMANCE DOES NOT GUARANTEE FUTURE RESULTS.
Chris Ciovacco Archive |
© 2005-2022 http://www.MarketOracle.co.uk - The Market Oracle is a FREE Daily Financial Markets Analysis & Forecasting online publication.