


What Next for the Stock Market and Gold?
Stock-Markets / Financial Markets 2011 Oct 12, 2011 - 04:20 AM GMTBy: J_W_Jones

 A lot of eyes were watching the Slovakian Parliament around the closing bell today as they voted on the European Financial Stability Fund (EFSF). The first vote failed to pass the pending legislation, but members of the opposition party have indicated that they will vote for the bill in a second scheduled vote.
The S&P 500 E-Mini futures contract has not sold off sharply on the news, but the trap door risk for equity traders is that the second vote comes up short and the legislation fails unexpectedly. The marketplace is expecting the second vote to pass without issue and if a different scenario plays out selling pressure could become extreme potentially. With earnings season now upon us, there is plenty of headline risk to go around and this Slovakian situation just adds more complexity to the news flow.
We have seen the S&P 500 Index rally more than 10% in five trading sessions which could potentially mean we have more downside work to accomplish before probing higher. The flip side of that argument is that prices continue to rally and push towards key resistance levels overhead. At this point in time, I do not have an edge for a directional trade so I am sitting on the sidelines presently. I do have a few time decay based trades in place, but they do not have a directional bias so my book is flat here.
The S&P 500 is a tough buy after a 10% rally in such a short period of time, but the strength and momentum are tough to short. The buyers seem to be higher and the sellers appear to be lower which complicates a potential entry even further. Presently there appears to be two possible scenarios:
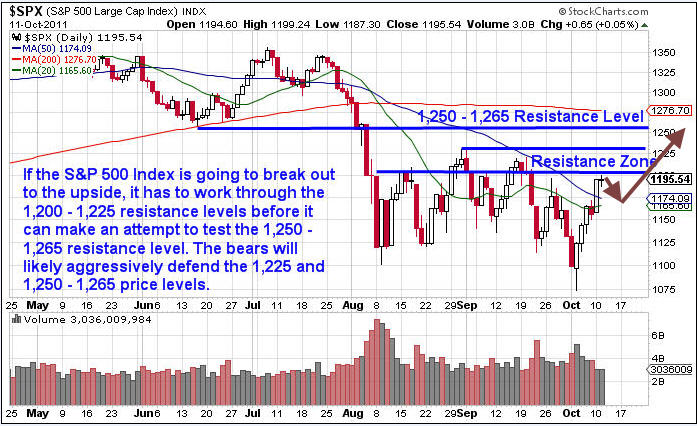
Bullish Scenario
The daily chart of the S&P 500 Index is shown below with key overhead resistance levels illustrated on the chart and the potential price action in coming days:
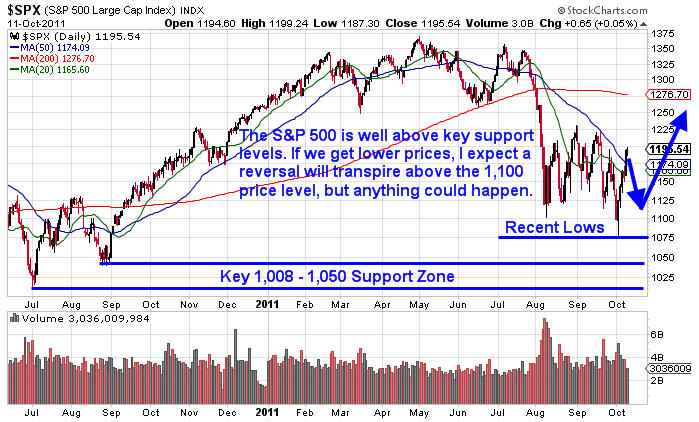
Bearish Scenario
The daily chart of the S&P 500 Index is shown below with key support levels and the potential price action if price works lower:
Overall, I do not have a real edge on the S&P 500 at this point. A pullback makes some sense here, but defined risk metrics and a trading plan must be used to reduce risk. Regardless of the price direction traders are considering, this is a situation where proper position sizing and stop orders can allow a trader to take on a defined risk that he/she is comfortable with.
This market has been tough to trade for several weeks. The price action has been choppy and volatility levels have been elevated since the early part of August. This type of market environment chops up a lot of traders and it sucks bulls and bears into the price action late in the game opening the door for potentially devastating losses if risk is not properly defined. My Trading partner Chris Vermeulen pocketed over 38% gain during these choppy times using bull and bear ETFs with is subscribers.
As an option trader familiar with a variety of spreads, recently I have been utilizing the elevated volatility levels to sell option premium and use the passage of time as a primary profit engine for my open positions. Currently I have 3 open positions which are all taking advantage of the passage of time as a profit engine.
Back on 9/26 I entered a $DIA Iron Condor Spread to take advantage of heightened volatility and capitalize on time decay leading up to the October monthly option expiration. On 10/06 I was able to close the $DIA position to lock in 15% based on maximum risk. Even though price action was excessively volatile during the past several weeks, my $DIA trade was never a major concern in terms of price action. No adjustments were necessary and members and I pocketed some relatively quick money watching the days pass by.
Gold Analysis
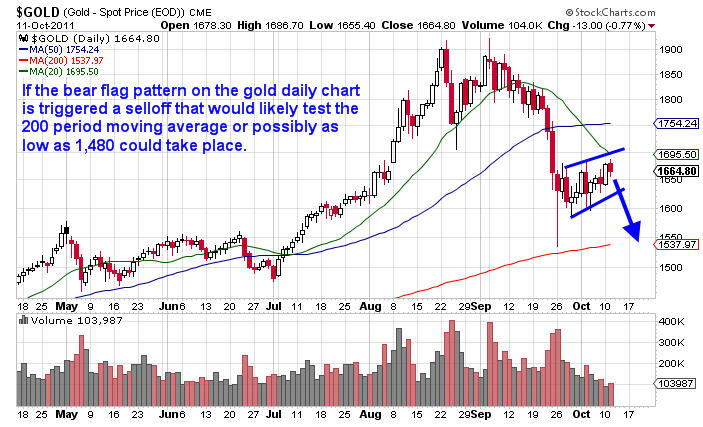
The recent price action in gold has been equally as tough to trade as the S&P 500 Index. After rallying sharply into early September, gold prices plummeted and price action has been consolidating ever since. Similar to the price action in the S&P 500, gold prices have just chopped around for several weeks. Gold is currently trading in a bear flag formation which if triggered could result in additional downside.
In the short-term more downside is always possible, but in the longer-term I think higher prices are probable for both gold and silver as this money printing binge will one day end and inflationary pressures may present themselves at that time. The weekly chart of gold futures is shown below:
As can be seen above, gold has traded in a long term rising channel for over a year. Back in August and September gold prices broke out to the upside of the rising channel and went parabolic. In the beginning of September, gold prices sold off sharply back down into the previous rising channel. As it stands right now, gold prices remain near the upper resistance level of that channel and have not tested the lower support line since February.
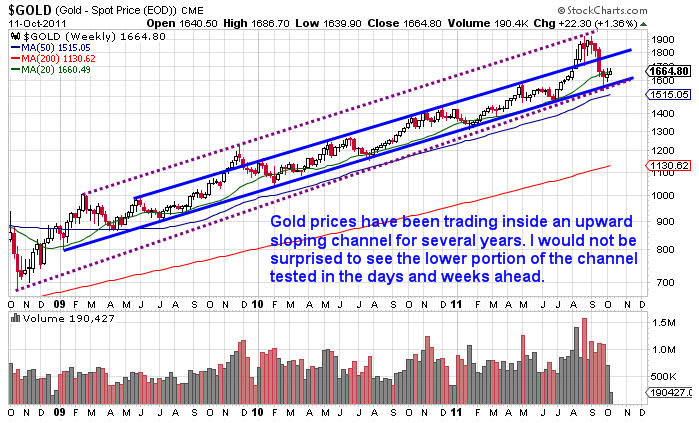
If gold prices do begin to rollover in the days and weeks ahead, a logical entry point would be a test of the lower channel. The price level I would be watching for would be around $1,500 an ounce. If we get to that area, I would not be shocked to see an overthrow of that support level and a test of the 1,480 price level before reversing to the upside.
The other side of this story is that the U.S. Dollar Index falls out of favor again and its price gets crushed. If the U.S. Dollar gets hammered lower, it would make sense that U.S. domestic equities would rally along with other risk assets such as gold, silver, and oil. Right now I do not have a clear short term bias, but in the intermediate to longer term cycles I remain quite bullish. If the gold price does work back down to that support level, I will be looking to get long. Another possible long entry would present itself on a breakout to the upside back out of the upward sloping channel.
Gold is quite volatile and is impacted by a litany of outside forces such as foreign currency and the U.S. Dollar. For right now the short term bias could be to the downside, but when this period of malaise in the yellow metal ends the next bullish phase of this move higher is going to be quite strong.
As I have said many times, sometimes the best trade is no trade at all. Right now I do not have an edge in either the S&P 500 or gold so I am just going to sit and watch price action patiently while looking for high probability, low risk setups to emerge.
Review my track record and join now at http://www.optionstradingsignals.com/specials/index.php and receive a 66% off coupon which expires tomorrow.
J.W. Jones is an independent options trader using multiple forms of analysis to guide his option trading strategies. Jones has an extensive background in portfolio analysis and analytics as well as risk analysis. J.W. strives to reach traders that are missing opportunities trading options and commits to writing content which is not only educational, but entertaining as well. Regular readers will develop the knowledge and skills to trade options competently over time. Jones focuses on writing spreads in situations where risk is clearly defined and high potential returns can be realized.
This article is intended solely for information purposes. The opinions are those of the author only. Please conduct further research and consult your financial advisor before making any investment/trading decision. No responsibility can be accepted for losses that may result as a consequence of trading on the basis of this analysis.
© 2005-2022 http://www.MarketOracle.co.uk - The Market Oracle is a FREE Daily Financial Markets Analysis & Forecasting online publication.