


Gold About to Enter Accumulation Zone
Commodities / Gold and Silver 2011 Oct 03, 2011 - 02:53 AM GMTBy: Clive_Maund

 In classic fashion gold's brutal plunge ended in a zone of strong support just above its 200-day moving average. Normally, a drop of this severity would lead to more downside action, but there is now strong evidence that gold hit bottom last Monday, and that it is now basing prior to turning higher again.
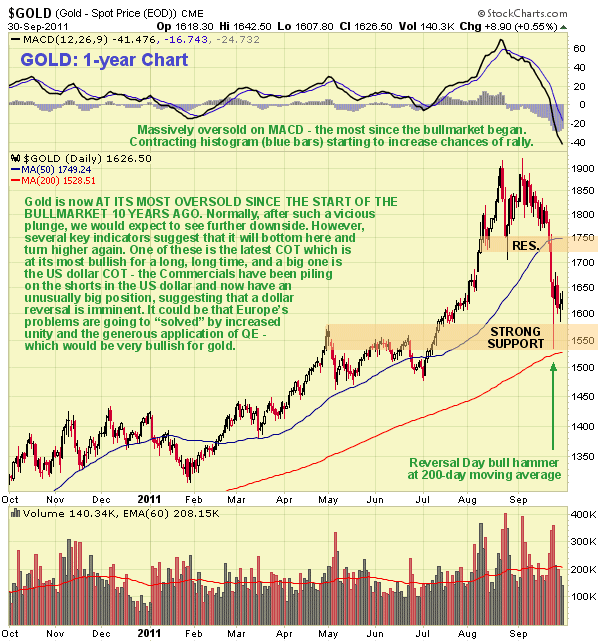
We can see the latest action on our 1-year chart for gold, which shows that once gold broke down below the support (now resistance) at the lower boundary of its intermediate top area, it went into an accelerating decline that culminated in a vertical plunge back to a point just above the 200-day moving average, where a large "bull hammer" formed that we will look at in more detail on the 3-month chart. It is no coincidence that the decline halted both at the 200-day moving average, as just mentioned, and in the zone of strong support shown where premature sellers in the April - July trading range are now buying and underpinning the price. Gold is now massively oversold at this juncture - it is the most oversold it has ever been since the bullmarket began over 10 years ago, and considerably more oversold than it was during the 2008 market meltdown, as we can see by reference to the MACD indicator at the top of the chart, which has never registered such a low reading, and it has in addition dropped way below its 50-day moving average. While we might normally infer from the severity of this drop that there is more downside to come, there are other factors, principally the COTs for gold, silver and the US dollar, which strongly suggest that gold is going to turn higher again before much longer.
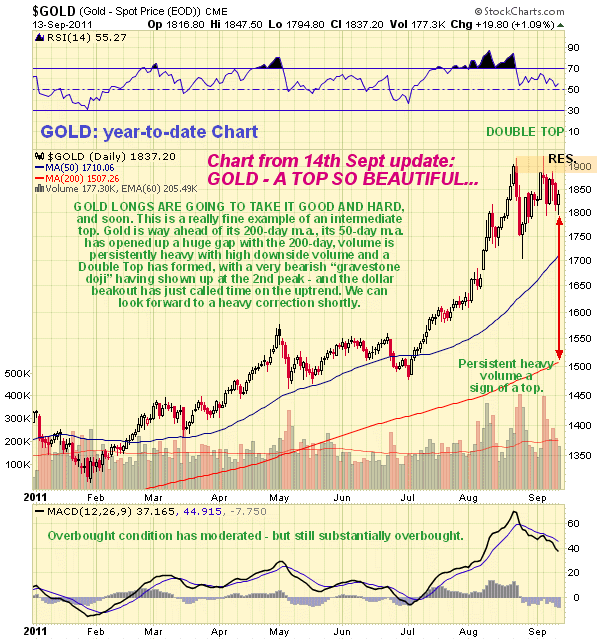
Below is the chart for gold from the article "GOLD - A TOP SO BEAUTIFUL, IT MAKES YOU WANT TO CRY", which appeared on the site on 14th September.
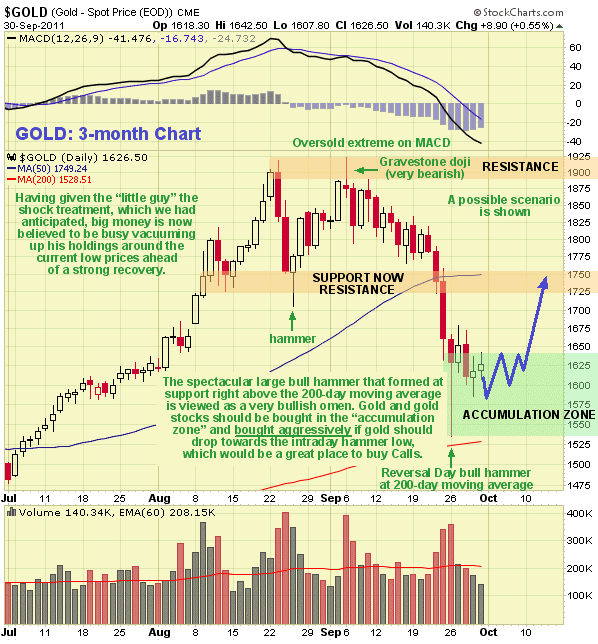
The 3-month chart for gold is very interesting as it allows us to examine recent action in considerably more detail. On this chart we can see how gold plunged upon breaching the support at the bottom of its intermediate top area, and how the decline suddenly, but predictably, halted when it got to its 200-day moving average, where a large pronounced bull hammer candlestick appeared, which was a very positive development. While the shock administered to sentiment by the steep drop means that gold may need to base around these levels for a while before a recovery can gain traction, other factors, principally the COTs suggest that it is likely to recover sooner than we might otherwise think. For this reason it is thought to be prudent for those wishing to go long here or add to holdings to do so immediately as we are now in the accumulation zone, and whilst recognizing that the price could very well drop back towards the hammer lows, it could instead advance almost immediately, so that there a danger of missing it. However, if it does drop back towards the hammer lows it should be bought aggressively, and this would be an excellent point to lock in leverage by buying Calls, either in gold, in gold bull ETFs or in the better gold stocks.
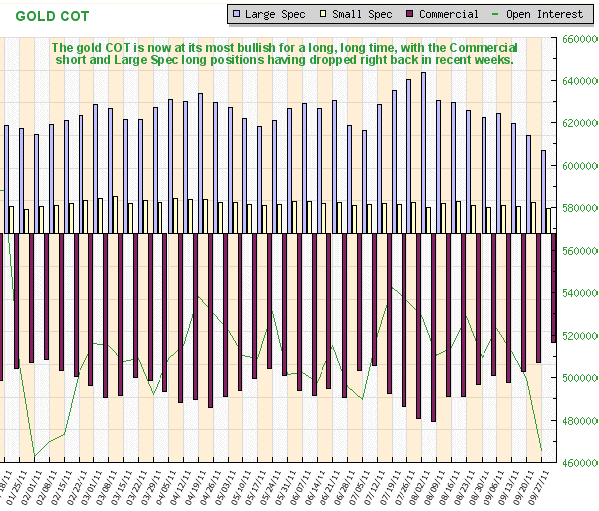
The latest COT charts for gold are VERY bullish, with Commercial short and Large Spec long positions having dropped to their lowest levels for a very long time, as we can see on the COT chart below...
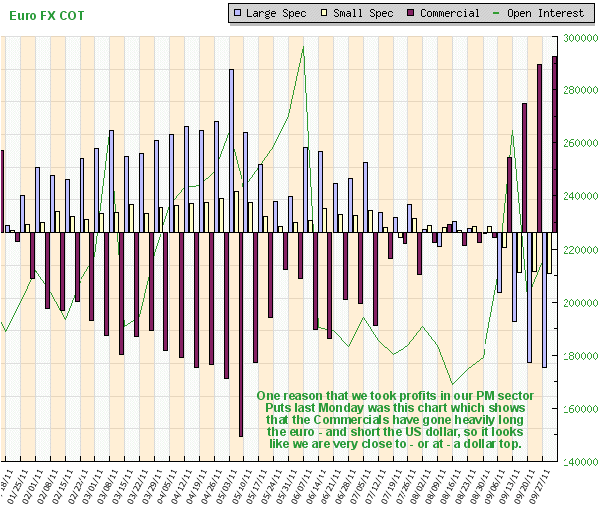
The dollar COTs are becoming very bearish, with the Commercials now having accumulated a heavy short position. This means that the dollar rally may soon be history, which suggests that some kind of breakthrough may be imminent regarding the crisis in Europe. This would logically involve more integration and the commitment to a massive blast of QE, Fed style, in order to mitigate the liquidity problems arising from the insolvency of member states. Needless to say, if Europe graduates to the elite super QE club, it will be great news for gold and silver, and for commodities generally. We can see the inverse of the big Commercial short position in the dollar on the COT chart for the euro fx, which shows that the Commercials have accumulated a massive long position in the euro.
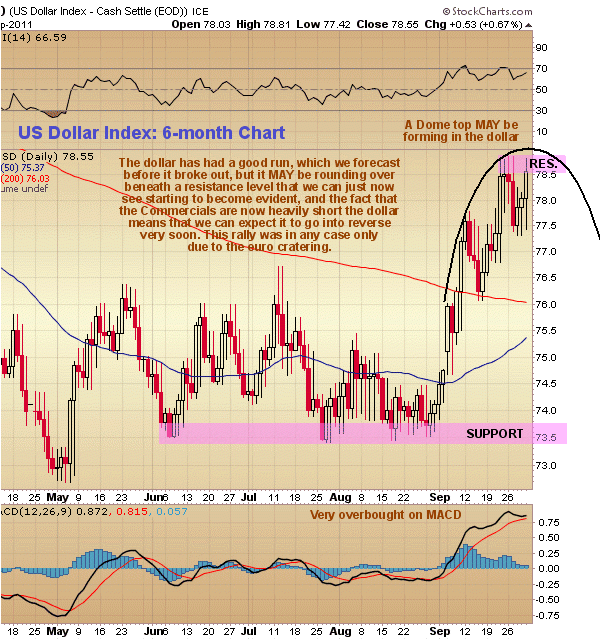
On the 6-month dollar index chart we can see the first signs of a potential reversal, following its blistering rally, which we predicted before it began. The dollar appears to be rounding over beneath a developing resistance level at the top of a potential Dome Top.
I have received the usual crop of Emails by traders caught out by the savage plunge in gold and silver over the past couple of weeks. They are bleating about "The Cartel" staging such an audacious raid or "drive by shooting", but what do they expect? - these people aren't operating as a charity - if the little guy buys a lot on margin, he can expect them to do this periodically to force him to cough up his holdings at knockdown prices. Technically, all that has happened is a healthy and predictable correction back to support near the 200-day moving average that serves to flush out weak longs and set the stage for renewed advance.
A small leveraged gold investor was caught on camera last week right after being fleeced...
By Clive Maund
CliveMaund.com
For billing & subscription questions: subscriptions@clivemaund.com
© 2011 Clive Maund - The above represents the opinion and analysis of Mr. Maund, based on data available to him, at the time of writing. Mr. Maunds opinions are his own, and are not a recommendation or an offer to buy or sell securities. No responsibility can be accepted for losses that may result as a consequence of trading on the basis of this analysis.
Mr. Maund is an independent analyst who receives no compensation of any kind from any groups, individuals or corporations mentioned in his reports. As trading and investing in any financial markets may involve serious risk of loss, Mr. Maund recommends that you consult with a qualified investment advisor, one licensed by appropriate regulatory agencies in your legal jurisdiction and do your own due diligence and research when making any kind of a transaction with financial ramifications.
Clive Maund Archive |
© 2005-2022 http://www.MarketOracle.co.uk - The Market Oracle is a FREE Daily Financial Markets Analysis & Forecasting online publication.