


Short-Term Conviction Faltering For Stock Market Bulls
Stock-Markets / Stock Markets 2011 Sep 30, 2011 - 10:36 AM GMTBy: Chris_Ciovacco

 The expression “we are stuck in a trading range” can lull investors into a state of short-term complacency, especially when the market has exceeded expectations since the early August low. While there were many important market moving events over the past seven weeks, the bulls tended to look forward to the Fed’s September 21 statement and Germany’s approval of the July 21 changes to the European Financial Stability Facility (EFSF). The Fed meeting disappointed and stocks reacted in a negative manner. It may be too early to grade the reaction to Thursday’s EFSF vote in Germany, but as we postulated on Wednesday, it appears as if the bullish gains following the vote may be short-lived.
A CNN article summarizes some of the concerns related to the latest version of the European bailout fund:
But there is now widespread agreement among economists and investors that the €440 billion fund is not big enough to be effective if some of the larger euro area economies fail. Some economists have estimated that the fund would need up to €2 trillion to bail out Spain or Italy. Both nations are struggling with unsustainable levels of debt and dim economic prospects.
“Even an enhanced EFSF will have barely €100 billion to throw at the bond market…minus, of course, any new commitments made to Greece” said Carl Weinberg, chief economist at High Frequency Economics, in a note to clients.
More recently, European officials have been discussing ways to increase the fund’s ability to absorb bad sovereign debt by leveraging its assets in some way. However, experts say the fund is unlikely to see an increase in the amount of money it is able to deploy.
It may take the Europeans several weeks or months to negotiate and ratify the next “solution” for the debt-ridden economies in the block. The Fed has signaled it will take action, but only if the data supports an imminent threat of deflation, which is not currently the case. It may be the bulls have little to hang their short-term hats on now.
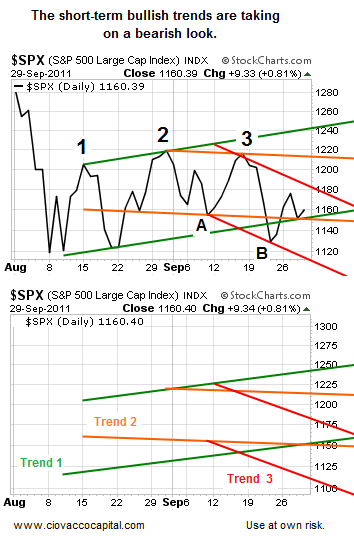
The markets have known for weeks that the problems in Europe will be with us for some time, which seems to be reflected in the S&P 500’s short-term trends. The S&P 500 has traded between 1,101 and 1,231 for seven weeks. As described and shown in the charts below, the bulls controlled the trading range from August 9 until the high was made on August 31. Since the S&P 500 hit 1,231 on August 31, we have gone four weeks without making a new high, which signals the bears have regained the upper hand within the trading range. The shifting trends below tell us the odds of a bearish break from the trading range have increased in recent weeks.
The bulls can regain some momentum by having the S&P 500 close over (a) 1,180, and (b) 1,220, but presently the bears are making a stealth move to recapture the short and intermediate-term trends. In the daily chart of the S&P 500 below:
- The green trendlines are formed by the first set of higher highs off the August lows (peak 1 and 2). The green trend is clearly bullish with a positive slope.
- The orange trendlines are based on a lower high made using peak 2 and 3. Notice the slope of the trend shifted from up to down.
- The red trendlines are based on the lower low that was made at point B relative to point A. The lower low at point B is one of the steps required in a trend change from up to down.
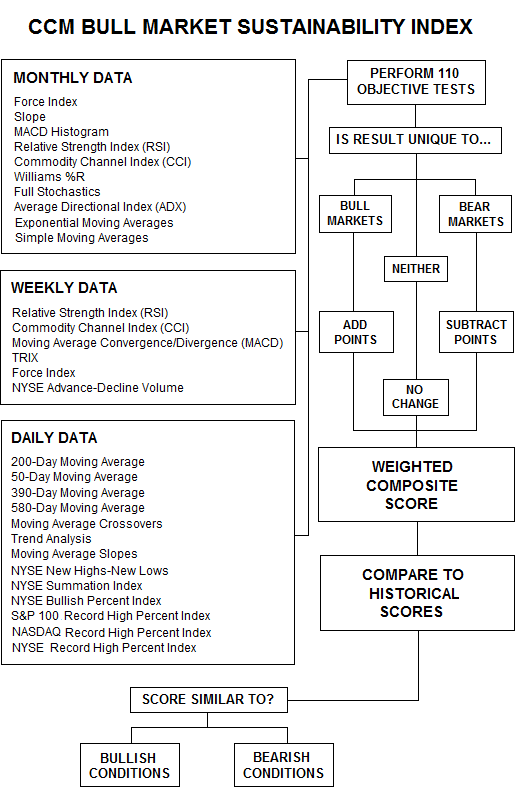
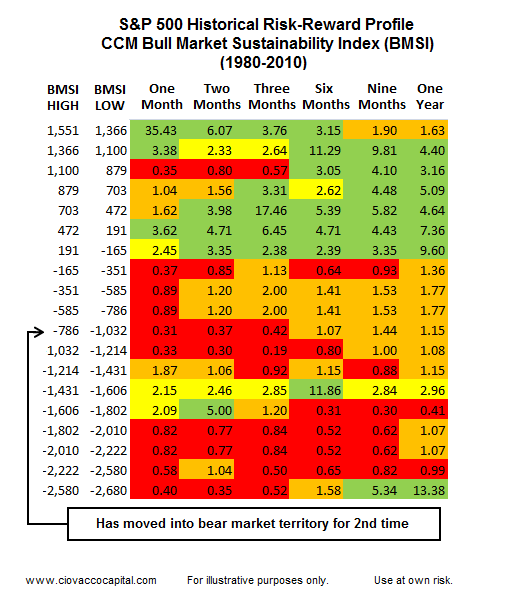
Investors should be careful about bullish predictions based on oversold readings from one technical indicator. As shown in the table below, the CCM Bull Market Sustainability Index (BMSI) uses a wide variety of ways to determine the probabilistic outlook for the stock market.
What does the Bull Market Sustainability Index tell us now about the longer-term outlook for stocks? It is bearish. In fact, the historical risk-reward profile is one of the worst looking out three months.
As we outlined on September 22, we still believe the odds strongly favor a bearish break of the current trading range and a move below 1,050 on the S&P 500. Consequently, we may add to our deflation-friendly bonds (TLT) and our stake in the U.S. dollar (UUP). We may also add shorts (SH) back into the mix very soon.
-
Copyright (C) 2011 Ciovacco Capital Management, LLC All Rights Reserved.
Chris Ciovacco is the Chief Investment Officer for Ciovacco Capital Management, LLC. More on the web at www.ciovaccocapital.com
Ciovacco Capital Management, LLC is an independent money management firm based in Atlanta, Georgia. As a registered investment advisor, CCM helps individual investors, large & small; achieve improved investment results via independent research and globally diversified investment portfolios. Since we are a fee-based firm, our only objective is to help you protect and grow your assets. Our long-term, theme-oriented, buy-and-hold approach allows for portfolio rebalancing from time to time to adjust to new opportunities or changing market conditions. When looking at money managers in Atlanta, take a hard look at CCM.
All material presented herein is believed to be reliable but we cannot attest to its accuracy. Investment recommendations may change and readers are urged to check with their investment counselors and tax advisors before making any investment decisions. Opinions expressed in these reports may change without prior notice. This memorandum is based on information available to the public. No representation is made that it is accurate or complete. This memorandum is not an offer to buy or sell or a solicitation of an offer to buy or sell the securities mentioned. The investments discussed or recommended in this report may be unsuitable for investors depending on their specific investment objectives and financial position. Past performance is not necessarily a guide to future performance. The price or value of the investments to which this report relates, either directly or indirectly, may fall or rise against the interest of investors. All prices and yields contained in this report are subject to change without notice. This information is based on hypothetical assumptions and is intended for illustrative purposes only. THERE ARE NO WARRANTIES, EXPRESSED OR IMPLIED, AS TO ACCURACY, COMPLETENESS, OR RESULTS OBTAINED FROM ANY INFORMATION CONTAINED IN THIS ARTICLE. PAST PERFORMANCE DOES NOT GUARANTEE FUTURE RESULTS.
Chris Ciovacco Archive |
© 2005-2022 http://www.MarketOracle.co.uk - The Market Oracle is a FREE Daily Financial Markets Analysis & Forecasting online publication.