


Astonishing Rise in Crude Oil Price Volatility
Commodities / Crude Oil Dec 11, 2007 - 12:53 PM GMTBy: George_Kleinman

Are you old enough to remember the good old days when gasoline was less than a buck a gallon? Consider the following.
Crude Oil 1994-95
This is a daily chart of the oil market for the 1994-95 trading period. Each vertical line represents one full day of trading. You're looking at approximately one full year of oil price trading. The chart appears to illustrate a volatile market with big ups and downs throughout this period, right? However, it all depends on how the chart is scaled.
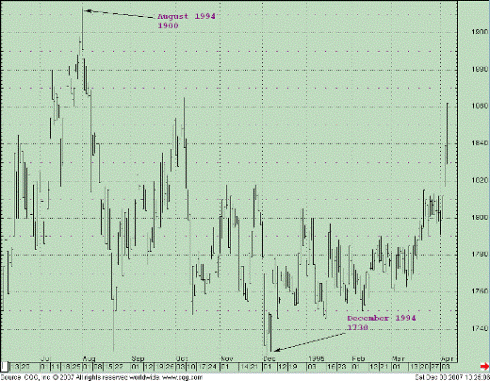
Source: Commodity.com
The price range over these 12 months saw an extreme high of $19 per barrel in August and a low of $17.30 in December. This is a $1.70-per-barrel range from high to low within the period. The size of one oil futures contract is 1,000 barrels. Therefore, every $1 move equals $1,000 profit or loss per contract traded. So over this 12 month period, there was a $1,700-per-contract range in price movement from the two extremes. This wasn't an atypical year for that period.
Today, the oil contract size is exactly the same, however volatility has exploded. Consider the following example from last week.
December 5 Oil Market
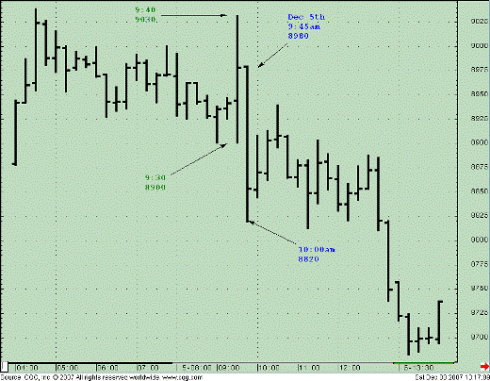
Source: Commodity.com
You're now looking at a 15-minute chart of the oil market for Dec. 5. Each vertical line represents only 15 minutes of trading (versus one day per line in the previous chart). You're viewing a few days worth of trading (versus about a year in the previous chart).
During the first highlighted bar, the price ranged from $89.00 per barrel to $90.30 per barrel in just one 10-minute period (from 9:30 am to 9:40 am CST). On the following bar, the range (in just one 15-minute period) was $89.80 to $88.20.
The first period saw a $1.30-per-barrel range, $1,300 per contract in just 10 minutes. Then in the immediately following period, there was a $1.60-per-barrel range equivalent to $1,600 per contract traded in the opposite direction. Within just this one half-hour period, there was a $2.10 per range equivalent to $2,100 per contract traded.
In other words, in only one half-hour last week, there was a larger price range than in the entire 1994-1995 trading year. And, believe it or not, this isn't atypical for the current market environment.
Why this dramatic rise in volatility? There are various reasons.
First, commodity demand has multiplied in recent years because of the dramatic industrial revolution in a number of countries, notably China. This demand increase (with a dose of inflation) has resulted in higher prices. Higher prices lead to larger ranges for the same percentage moves. At $19.00 per barrel of oil, a 10 percent move is equivalent to $1.90; at $90 per barrel of oil, a 10 percent move is equivalent to $9.
So this is part of it, but it doesn't fully explain the velocity and ferocity of today's market movements, let alone the volatility.
Remember the old days when you heard a song on the radio and wanted to buy the album? The process involved physically going to the record store, finding what you were looking for, and returning back home to play it. This process took time. Now you can identify and download music in seconds using the Internet.
The main reason for the increased speed of market movements also has to do with the Internet. It's a direct result of the dramatic shift during the past few years away from nearly 100 percent pit trading to nearly 100 percent electronic trading.
Until very recently, to place an order in the commodity markets required phoning an order to a trading floor where an order would be written down and time stamped by a clerk, passed to a runner who carried it to a broker in the trading pit. The pit broker would cue the order, and when the market approached the price, would yell out the buy or sell into the trading pit, looking for an offsetting trade via the open outcry process. Once filled, the process would reverse from runner to clerk, phoned back to broker or client.This all took time.
Now electronic trading orders are disseminated and received in milliseconds, virtually instantly over the Internet. Orders of all sizes from around the globe are now placed instantly with a mouse click eliminating this entire human process.
This volatility allows for many more opportunities, but also increases the risk geometrically versus the old days. So how does a trader cope with this rise in volatility? The answer lies with computing power.
We used to keep charts by hand, but now the computer draws the charts for us, and a computer is required to calculate those same market studies in real time we used to do at night by hand after the market closed.
15-Minute Oil Market
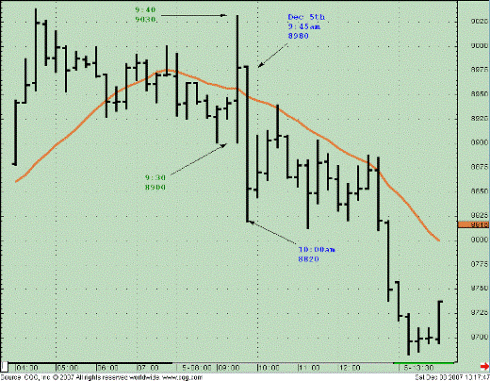
Source: Commodity.com
As an example, I've reproduced the 15-minute chart and superimposed a 15-period, simple moving average. By monitoring where the market is in relation to this average, particularly on a close for each period, the computer can help a trader identify the true internal trend of a market.
Today, a trader needs to compress his time parameters and use computing power over shorter time spans. The computer won't eliminate the volatility and speed of today's markets, these factors are here to stay, but computing power in today's market environment is a necessity to analyze today's markets at a speed the human brain is incapable of doing.
Good luck, and good trading.
By George Kleinman
President
Commodity Resource Corp.
Lake Tahoe,
Nevada 89452-8700
http://www.commodity.com
George Kleinman is the President of the successful futures advisory and trading firm Commodity Resource Corp. (CRC). George founded CRC in 1983 while on the "floor" of the Minneapolis Grain Exchange to offer a more personalized level of service to traders. George has been an Exchange member for over 25 years. George entered the business with Merrill Lynch Commodities (1978 - 1983). At Merrill he attained the honor of 'Golden Circle' one of Merrill's top ten commodity brokers internationally. He is a graduate of The Ohio State University with an MBA from Hofstra University. George has developed his own proprietary trading techniques and is the author of three books on commodity futures trading published by the Financial Times.
He is Executive Editor of Futures Market Forecaster, a KCI Financial publication. In 1995, George relocated CRC to Nevada and today trades from an office overlooking beautiful Lake Tahoe. The firm assists individuals and corporate clients. CRC¹s exclusive clearing firm is R.J. O'Brien with all client funds held at RJO (assets in excess of $1.9 billion). Founded in 1914, R.J. O'Brien is a privately owned Futures Commission Merchant, and one of the most respected independent futures brokerage firms in the industry. RJO is a founding member of the Chicago Mercantile Exchange, a full clearing member of the Chicago Board of Trade, New York Mercantile Exchange, Commodity Exchange of New York and the New York Board of Trade. RJO offers the latest in order entry technology coupled with 24-hour execution and clearing on every major futures exchange worldwide. There is risk of loss when trading commodity futures and this asset class is not appropriate for all investors.
Risk Disclaimer
Futures and futures options can entail a high degree of risk and are not appropriate for all investors. Commodities Trends is strictly the opinion of its writer. Use it as a valuable tool, not the "Holy Grail." Any actions taken by readers are for their own account and risk. Information is obtained from sources believed reliable, but is in no way guaranteed. The author may have positions in the markets mentioned including at times positions contrary to the advice quoted herein. Opinions, market data and recommendations are subject to change at any time. Past Results Are Not Necessarily Indicative of Future Results.
Hypothetical Performance
Hypothetical performance results have many inherent limitations, some of which are described below. No representation is being made that any account will or is likely to achieve profits or losses similar to those shown. In fact, there are frequently sharp differences between hypothetical performance results and the actual results subsequently achieved by any particular trading program. One of the limitations of hypothetical performance results is that they are generally prepared with the benefit of hindsight. In addition, hypothetical trading does not involve financial risk, and no hypothetical trading record can completely account for the impact of financial risk in actual trading. For example, the ability to withstand losses or to adhere to a particular trading program in spite of trading losses are material points which can also adversely affect actual trading results. There are numerous other factors related to the markets in general or to the implementation of any specific trading program which cannot be fully accounted for in the preparation of hypothetical performance results and all of which can adversely affect actual trading results.
George Kleinman Archive |
© 2005-2022 http://www.MarketOracle.co.uk - The Market Oracle is a FREE Daily Financial Markets Analysis & Forecasting online publication.