


Stock Market Glass More Half Empty Than Half Full
Stock-Markets / Stock Markets 2011 Sep 06, 2011 - 08:16 AM GMTBy: Richard_Shaw

 The battle between bulls and bears is tense right now (as the attached cover image from this week's Barrons illustrates)
WHAT WE SAID BEFORE:
We have previously provided charts and data supporting the Bull case, showing high and growing earnings with historically "normal" range valuation multiples, at the same time that bonds offer little in terms of yield and must eventually go down when rates must eventually go up -- with many stocks (even the S&P 500 index) providing dividend yields competitive with 10-year Treasuries.
We have also previously provided various data about a slowing world economy, rising inflation, unresolved (just reshuffled) debt burdens, seemingly insurmountable sovereign debt issues in some parts of Europe, and an eventual train wreck for the US fiscal situation given current commitments versus revenues, bank asset problems in China, high levels of unemployment in the US and Europe and other factors that are not good for stocks.
HOW WE JUDGE THE SITUATION NOW:
The glass is more half empty than half full in our view.
SOME SPECIFICS INFORMING OUR JUDGEMENT:
Rising and Falling 200-day averages: Consider this. We measured how many of the stocks in the NYSE and NASDAQ combined have 200-day moving averages that are flat or sloping upward over the past week (it takes a lot to turn a positive 200-day average down, or a negative one up). Of the total 45.9% were flat to up. The remaining 54.1% were sloping down.
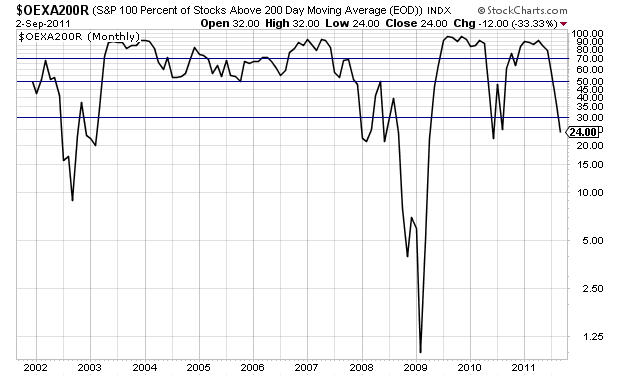
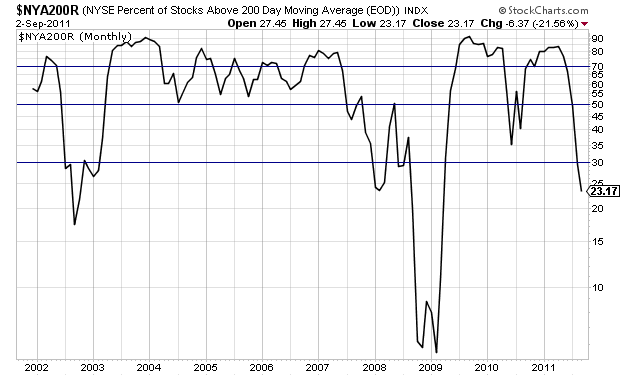
Stocks Above and Below Their 200-day Average: We asked what percentage of stocks are above their 200-day average and how many are below. Generally fewer than 25% are above their 200-day average . We ran the test on the S&P 100 (the mega-cap stocks), the S&P 500 (the large-cap stocks), the NASDAQ 100 (the large technology stocks), the NASDAQ in its entirety, and the New York Stock Exchange in its entirety. They all had similar results. The two attached charts are for the S&P 100 (OEX) and the New York Stock Exchange (NYA).
You might make these observations:
1. the situation is worse than during the 2010 market correction (about the same for OEX and worse for NYA)
2. the situation has never been like this when the market has been "good"
3. the situation looks similar to 2002 and 2008, which were not good years.
This is not to say that we are in 2008 again (although that is what the CEO of Deutsche Bank says if feels like), but it is hard to feel like the glass is more half full than half empty with charts and data like this.
"Sept. 5 (Bloomberg) -- Deutsche Bank AG Chief Executive Officer Josef Ackermann said conditions in the stock and bond markets are reminiscent of the financial crisis of late 2008."
Current Market Price Action:
The US markets were closed today, but the rest of the world was open, and it was a bloody day. The STOXX (600 large-cap European stocks) were down 5.11%. Germany was down 5.28%. France was down 4.73%. Italy was down 4.83%. Spain was down 4.69%. The U.K was down 3.58% . Asian stocks were off, but not as much, and are down again in the overnight session.
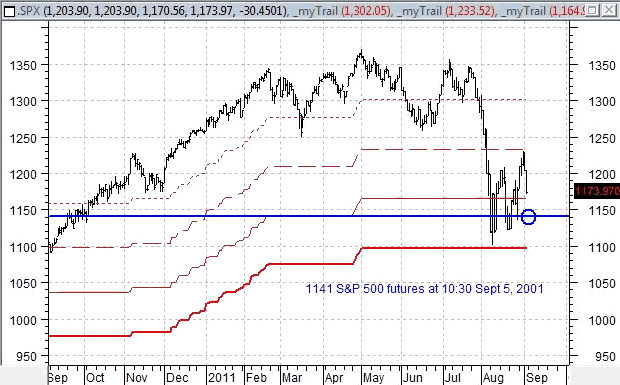
The futures for the S&P 500 are down over 2.8% as of 10:30 PM. The price chart for the S&P 500 showing a failure of the rally.
We have substantially lightened stock positions some weeks and months ago, and are holding that for the time being. We regret that we exited gold positions during its sudden and expected fall from a near vertical rise. The exit was profitable, but gold has since risen, and with the rapidly evolving debt crisis and political crisis in Germany over the bailout of Greece, gold has gone just above 1900.
As we pointed out in an earlier email today, there are several events schedule to take place between now and the end of the year that will increase volatility and probably cause some strong whipsaw reversals. We are in the grip of a market driven by the utterances and policies of governments and central banks.
S&P 500 Year-End Price Predictions from Several Leading Voices (from Barron's this week) [last price 1174, futures now 1141]:
1. David Bianco (Bank of America/Merrill Lynch) 1400 2. Binky Chadha (Deutsche Bank) 1425 3. Doublas Cliggot (Credit Suisse) 1100 4. Robert Doll (BlackRock) 1250 5. David Kelly (JP Morgan) 1300 6. Barry Knap (Barclays Capital) 1450 7. David Kostin (Goldman Sachs) 1400 8. John Praveen (Prudential) 1400 9. Michael Ryan (UBS) 1225 10. Jason DeSena Trennert (Strategas Ressearch Partners) 1165
Our Current Recommendation:
Keep stock allocation powder dry, unless you are very sure of the value to you of particular investments, or unless you have a multi-year holding plan should things go horribly wrong in the near-term.
By Richard Shaw
http://www.qvmgroup.com
Richard Shaw leads the QVM team as President of QVM Group. Richard has extensive investment industry experience including serving on the board of directors of two large investment management companies, including Aberdeen Asset Management (listed London Stock Exchange) and as a charter investor and director of Lending Tree ( download short professional profile ). He provides portfolio design and management services to individual and corporate clients. He also edits the QVM investment blog. His writings are generally republished by SeekingAlpha and Reuters and are linked to sites such as Kiplinger and Yahoo Finance and other sites. He is a 1970 graduate of Dartmouth College.
Copyright 2006-2011 by QVM Group LLC All rights reserved.
Disclaimer: The above is a matter of opinion and is not intended as investment advice. Information and analysis above are derived from sources and utilizing methods believed reliable, but we cannot accept responsibility for any trading losses you may incur as a result of this analysis. Do your own due diligence.
Richard Shaw Archive |
© 2005-2022 http://www.MarketOracle.co.uk - The Market Oracle is a FREE Daily Financial Markets Analysis & Forecasting online publication.