


Stock Market 6 Year Cycle Peak is Near
sitenews / Cycles Analysis Aug 31, 2011 - 02:45 AM GMTBy: Clif_Droke

 In just a few weeks the Kress 6-year cycle will peak. What transpires in the financial market in the weeks and months following this important event will be partly determined by the reactive policies of the central bank. But in the longer-term scheme of things, even the Fed is powerless to stop the events that will increase in intensity beginning next year and into the year 2014.
In this article we'll examine how the 6-year cycle influences the financial market outlook in its relationship to the longer-term cycles. Although the 6-year cycle is one of the smallest of the yearly Kress cycles, it is by no means irrelevant. Despite its diminutive size it typically packs a wallop, especially when the nearest long-term cycle is in its declining phase, as is the case this year.
Let's take a look at the last few peaks and bottoms of this cycle. In 2008, when the 6-year cycle descended with a mighty crash, it nearly brought down the entire global financial market. The final "hard down" phase (i.e. last tenth) of the previous 6-year cycle in 2008 was also exacerbated by the subprime mortgage crisis. From this we can surmise that the 6-year cycle has a much larger impact when the financial market's internal bias is to the downside. Yet even this downward bias is the product of the long-term cycles which comprise the Kress 120-year cycle. These long-term cycles have been mostly in the declining phase since 2000, with the final "hard down" phase beginning in 2008.
The effect of the previous 6-year cycle bottom in late 2002 was doubled by the simultaneous bottom of the 12-year cycle that year. You may recall that 2002 was the year that witnessed a great bear market in Internet and tech stocks. The lifting of the cyclical downside pressure associated with the 6-year cycle in late 2002 led to an equities market in rebound in 2003 and beyond, showing the power of this particular cycle.
There are two conclusions which can be drawn from our study of the 6-year cycle thus far. The first is that whenever it bottoms, it always has a material impact on equity prices unless the yearly cycle of the next highest degree is rising (which mitigates the downward force of the bottoming 6-year cycle). This explains why the market was able to keep rising after the year-year cycle peaked in 2005, because the 10-year and 12-year cycles were still rising.
One notable event that occurred in 2005 during the peaking of the 6-year cycle, however, was the London bombings on July 7 that year. Six years later, during the latest 6-year cycle peaking phase, we witnessed yet another violent outburst in London, this time in the form of rioting that took place between August 6-10. Also in July this year we witnessed the Oslo, Norway bombing and shootings. We've seen that there is a correlation between peaks and bottoms of the 6-year cycle and stock market turning points. Could there also be some correlation between 6-year cycle peaks and violent behavior? I leave that for future research to decide.
In the case of the 6-year cycle peak of late 1996, the powerful 30-year cycle component of the 120-year Master Cycle was still rising. This in turn propelled stocks to higher highs until the 30-year cycle peaked in late 1999 - a year which also witnessed the 6-year cycle peak and was followed by a bear market in 2000 and beyond.
By contrast, in those years in which the next cycle of highest degree is falling, the bottom of the 6-year cycle will exert a decidedly negative impact on stocks. In 1990, for instance, the 6-year cycle bottomed later that year along with the 12-year and 24-year cycles. Because these two larger cycles were in the final "hard down" phase heading into 1990, it came as no surprise that 1990 witnessed a bear market along with 271 bank failures.
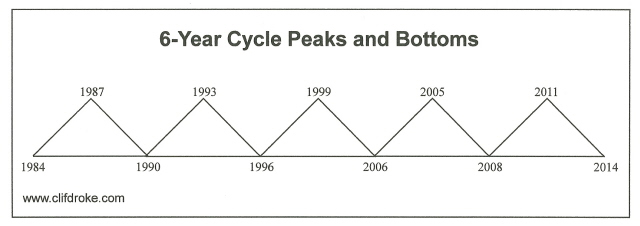
The chart below depicts the 6-year cycle in its peak and trough phases from 1984 and beyond. The final 6-year cycle components of the 120-year cycle, after peaking in a few weeks, will bottom in late 2014.
The year 1993 also witnessed a peak of the 6-year cycle. Although the Dow Industrials did peak in late September/early October along with the cycle and declined into late October, the worst of the damage didn't occur until a few months later in the winter and spring of 1994, during which time the 10-year cycle was in its final "hard down" bottoming phase.
The infamous year 1987 also witnessed a peak of the 6-year cycle which occurred around the time of the October '87 stock market crash. The October '87 market crash was arguably the most textbook example of a 6-year cycle peak and its direct impact on stock prices in recent memory. The market imploded on October 19, 1987 - just a couple of weeks following the orthodox peak of the 6-year cycle.
In light of this brief overview of the 6-year cycle, investors should exercise caution after September and entering the October period of the latest peak of the 6-year cycle, given the market's historical tendency to underperform following this cycle's peak.
Price of Gold
Gold closed under its dominant immediate-term trend line on Wednesday, Aug. 24, to break the immediate-term momentum that gold had enjoyed through the last two months. Although the immediate-term trend line was broken, the recent action of the gold price shows that the important 30-day moving average has acted as a strong support and has managed to reverse the recent selling pressure in gold (see chart below). This encouraged the buyers to jump in and take advantage of the support and they ended up bidding gold back up to the $1,833 level as of Tuesday, Aug. 30.
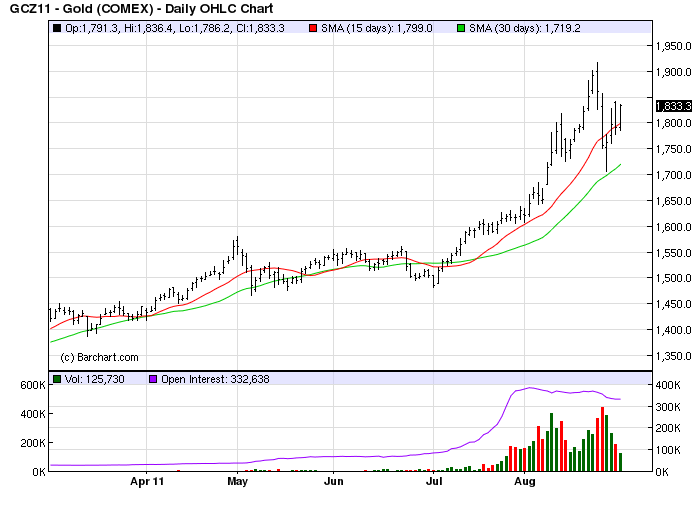
Although gold still remains above the dominant short-term 30-day moving average, there are reasons for being concerned about gold's short-term outlook. For starters, the gold price has clearly been galvanized by the extremely high levels of fear over the debt situation. Indeed, gold fed off this unabated fear for most of July and August before the fear temporarily broke last week during an interim weekly cycle bottom.
Although we're entering a bullish seasonal time frame for gold, there is reason to believe that while the 6-year cycle is peaking in September - which presumably will be positive for equities - gold could lose some of its luster until the cycle peaks around Oct. 1. For that reason gold investors might want to think about taking some profits acquired during the recent run-up and raising stops on existing short-term trading positions. The 30-day moving average is a key support/benchmark to watch in the near term.
Gold & Gold Stock Trading Simplified
With the long-term bull market in gold and mining stocks in full swing, there exist several fantastic opportunities for capturing profits and maximizing gains in the precious metals arena. Yet a common complaint is that small-to-medium sized traders have a hard time knowing when to buy and when to take profits. It doesn't matter when so many pundits dispense conflicting advice in the financial media. This amounts to "analysis into paralysis" and results in the typical investor being unable to "pull the trigger" on a trade when the right time comes to buy.
Not surprisingly, many traders and investors are looking for a reliable and easy-to-follow system for participating in the precious metals bull market. They want a system that allows them to enter without guesswork and one that gets them out at the appropriate time and without any undue risks. They also want a system that automatically takes profits at precise points along the way while adjusting the stop loss continuously so as to lock in gains and minimize potential losses from whipsaws.
In my latest book, "Gold & Gold Stock Trading Simplified," I remove the mystique behind gold and gold stock trading and reveal a completely simple and reliable system that allows the small-to-mid-size trader to profit from both up and down moves in the mining stock market. It's the same system that I use each day in the Gold & Silver Stock Report - the same system which has consistently generated profits for my subscribers and has kept them on the correct side of the gold and mining stock market for years. You won't find a more straight forward and easy-to-follow system that actually works than the one explained in "Gold & Gold Stock Trading Simplified."
The technical trading system revealed in "Gold & Gold Stock Trading Simplified" by itself is worth its weight in gold. Additionally, the book reveals several useful indicators that will increase your chances of scoring big profits in the mining stock sector. You'll learn when to use reliable leading indicators for predicting when the mining stocks are about o break out. After all, nothing beats being on the right side of a market move before the move gets underway.
The methods revealed in "Gold & Gold Stock Trading Simplified" are the product of several year's worth of writing, research and real time market trading/testing. It also contains the benefit of my 14 years worth of experience as a professional in the precious metals and PM mining share sector. The trading techniques discussed in the book have been carefully calibrated to match today's fast moving and volatile market environment. You won't find a more timely and useful book than this for capturing profits in today's gold and gold stock market.
The book is now available for sale at: http://www.clifdroke.com/books/trading_simplified.html
Order today to receive your autographed copy and a FREE 1-month trial subscription to the Gold & Silver Stock Report newsletter. Published twice each week, the newsletter uses the method described in this book for making profitable trades among the actively traded gold mining shares.
By Clif Droke
www.clifdroke.com
Clif Droke is the editor of the daily Gold & Silver Stock Report. Published daily since 2002, the report provides forecasts and analysis of the leading gold, silver, uranium and energy stocks from a short-term technical standpoint. He is also the author of numerous books, including 'How to Read Chart Patterns for Greater Profits.' For more information visit www.clifdroke.com
© 2005-2022 http://www.MarketOracle.co.uk - The Market Oracle is a FREE Daily Financial Markets Analysis & Forecasting online publication.