


Stock Market Dip Buyers Beware: Odds Favor Lower Lows in Stocks
Stock-Markets / Stocks Bear Market Aug 22, 2011 - 05:29 AM GMTBy: Chris_Ciovacco

 Whether you rely on fundamentals, technicals, or a combination of both, investment analysis centers around looking at probabilistic future outcomes based on historic outcomes that occurred under similar circumstances. Given the weight of the fundamental and technical evidence we have in hand and in the context of history, the odds have shifted from favoring higher highs in stocks and risk assets to favoring lower lows. Until conditions improve, we will continue to err on the side of caution and treat the current market climate as unfavorable for intermediate to longer-term investing. We have minimal exposure to global stocks. We have positions in gold (GLD), silver (SLV), bonds (TLT), and cash.
Investors can expect debt problems in Europe to remain for some time. According to the New York Times:
Chancellor Angela Merkel of Germany on Sunday re-emphasized her opposition to issuing bonds backed by all the euro zone countries, a position that will be greeted enthusiastically by many of her fellow citizens but could unsettle investors at the beginning of what could be another difficult week in global financial markets.
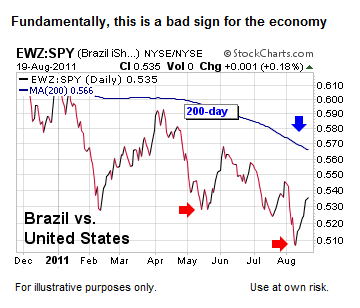
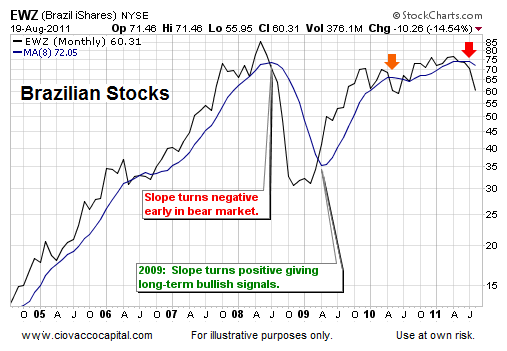
From a fundamental perspective, economically sensitive areas of the market are weak. Materials stocks look vulnerable to more downside, which does not bode well for future economic activity. Commodity producing countries, such as Brazil, led the markets higher off the March 2009 lows. Brazilian stocks (EWZ) now look weak relative to the S&P 500 (SPY), which means they are laggards, not leaders (see below).
The strong interest in bonds (TLT) and the across-the-board weakness in global stocks are bringing into question Wall Street’s canned responses of ‘buy on dips’, ‘this is an excellent buying opportunity’, ‘valuations look attractive’, and ‘you have to buy when there is blood in the streets’. On August 19, bond king Bill Gross told Reuters recent action in Treasuries should not be ignored:
“They certainly reflect, in terms of their yields, not only a potential for a recession but the almost high probability of recession and the result of lowering of inflation — that is key.”
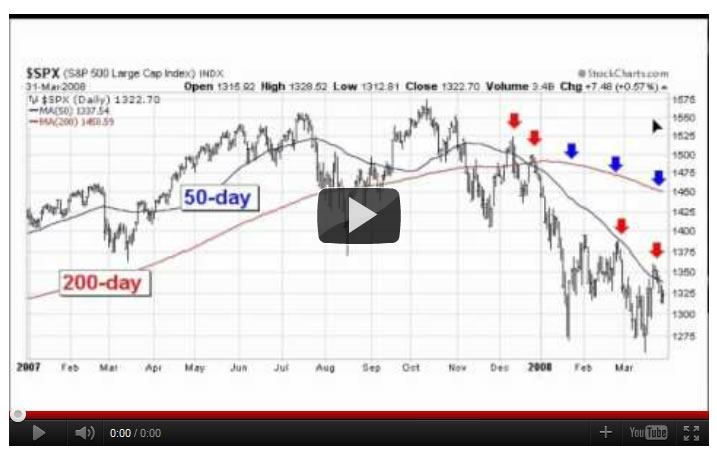
We agree the expressions above, related to dip-buying, will apply to this market at some point in the future, but the weight of the evidence screams loud and clear, “you better pay attention and you better have specific risk management plans in place”. The video below covers some actions you can take right now in terms of planning; actions that apply to do-it-yourselfers and investors working with an advisor. This is not the time to stick your investment head in the sand. Worst-case, you put together bear market contingency plans and throw them in the trash if conditions improve. The charts below look bearish longer-term; if they improve, we are happy to change our investment stance. Flexibility is always important. If you believe it is too late to sell, the video below is worth a look.
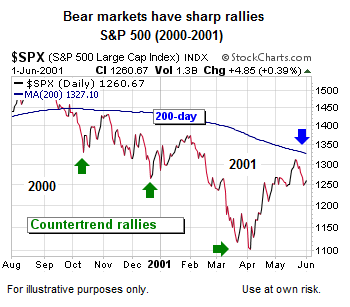
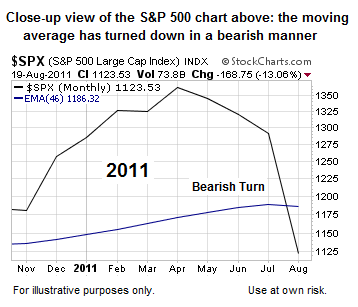
Even if the bearish odds correctly forecast investment outcomes over the coming months, sharp countertrend rallies, which can last several weeks or several months, are to be expected. Bull markets do not go straight up and bear markets do not go straight down. Notice during every bear market rally below, the slope of the S&P 500’s 200-day moving average was negative and price remained below the 200-day, which is what a bear market looks like. Today, price is below the S&P 500’s 200-day moving average and the slope is in the process of rolling over in a bearish fashion saying “be careful”.
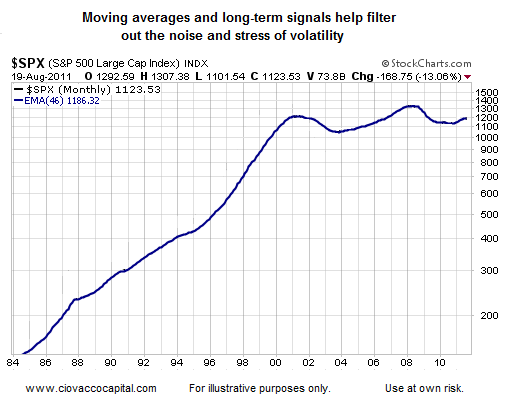
Volatility makes staying invested difficult in bull markets and remaining cautious difficult in bear markets. The chart below is a monthly chart of the S&P 500 Index going back to 1984. We have removed the month-to-month price swings and kept only the forty-six month exponential moving average (EMA). If you look at the chart below, it seems like it would have been relatively easy to remain invested from 1984 to 2000 since prices kept going up. In the year 2000, the odds shifted as the moving average turned down generating a “be careful” signal. Another “be careful” signal was generated in 2008 when the blue line again turned down. Looks easy – right?
The chart below is the same chart as the one above, except the month-to-month price swings have been added back. It doesn’t look so easy anymore. The basic ideas shown in the chart below apply to all the remaining charts:
- When price is above a moving average (blue line below), it is bullish.
- When price is below a moving average, it is bearish.
- When the slope of a moving average is positive, it is bullish.
- When the slope of a moving average is negative, it is bearish.
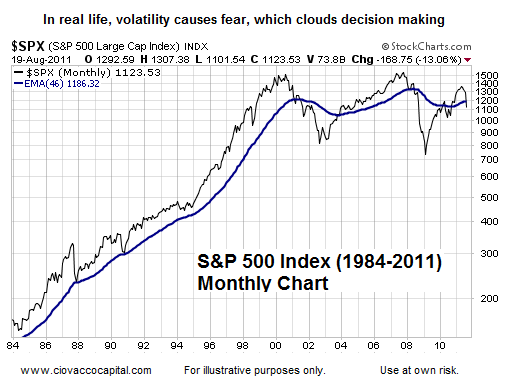
Notice in the chart above, price remained above the blue moving average from 1984 to 2000, which was bullish. Price broke below the moving average in 2000, 2008, and 2010, giving a “be careful” signal. More importantly when using the moving average above, notice the slope of the moving average remained positive from 1994 to 2000. The blue line gave a “be careful” signal in 2000 when it rolled over. It gave another bearish signal in 2008.
The slope of the monthly moving average on the chart of economically–sensitive and commodity-dependent Brazilian stocks (EWZ) recently rolled over in a bearish manner (see red arrow below right). The orange arrow demonstrates that stocks can recover after a change in the moving average’s slope, highlighting the need to always keep an open mind and remain willing to adjust in a bullish manner if conditions improve.
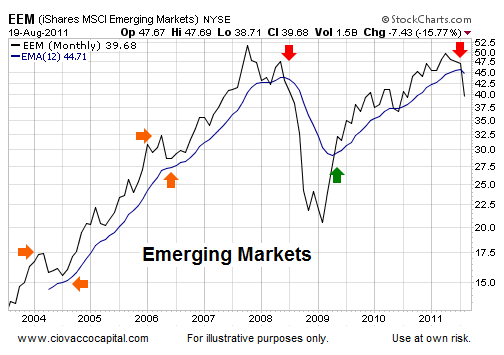
Rather than facing budget problems common to the United States and Europe, many emerging market countries are fighting a battle with inflation. Rising inflation can erode profit margins and put a crimp on consumer spending. The long-term fundamentals are better in emerging markets (EEM) relative to more developed nations, but their stock markets share troubling signs with the U.S. and Europe. When the monthly moving average shown in blue below rolled over in 2008, prices headed much lower. A similar bearish signal recently occurred in the Emerging Markets Index (red arrow on right).
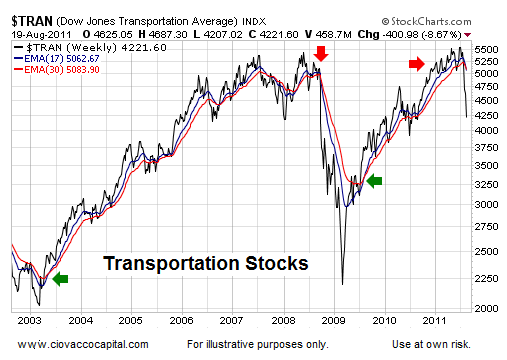
Transportation stocks are used in Dow Theory, based on their direct link to current and future economic activity. Another axiom for managing risk is when shorter-term moving averages are above longer-term moving averages, it is a good sign. When shorter-term moving averages cross over and below longer-term moving averages, it is a sign of weakness. In the 2003-2008 bull market in transportation stocks, the seventeen-week exponential moving average (blue line below) stayed above the thirty-week moving average (red line). “Be careful” signals were given in 2007 and 2008 (red arrow). Last week a new “be careful” signal was given. Notice how transportation stocks performed (very poorly) after the bearish signals (red arrows).
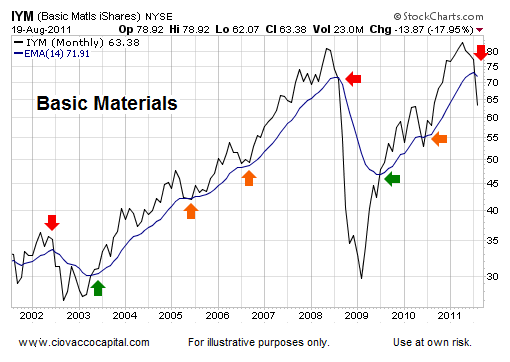
Economically-sensitive stocks of companies in the basic materials sector have tended to perform well when the blue moving average below has a positive slope (see green arrows). During bull markets, price held near the blue moving average line (orange arrows). The last two times the blue moving average line rolled over, price fell in a painful manner (red arrows). On the far right side of the chart, the blue moving average line just rolled over in a bearish manner, which adds to the bearish weight of evidence for the intermediate-to-longer-term outlook.
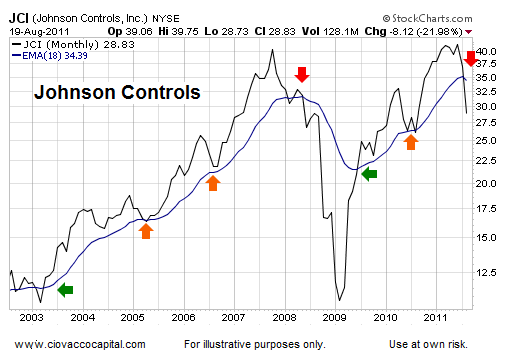
The same concepts outlined here can be applied to individual stocks. Johnson Controls (JCI) has a wide variety of business lines, including car batteries and HVAC systems. Like most companies, the demand for their products and services is higher when the economy is growing and unemployment is low. When the blue moving average shown below rolled over in 2008, it was a red flag for the economy and markets. In the first half of 2009, the moving average turned up signaling better economic times ahead (see green arrow). Notice how the price of Johnson Controls’ stock behaved after the moving average turned. Unfortunately, the moving average shown below for JCI recently turned negative (see red arrow on right below).
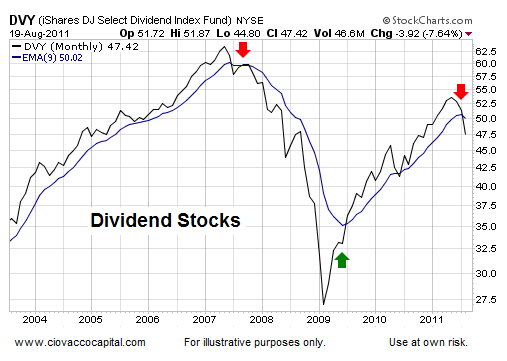
Dividend stocks have been popular investments based on the thinking the income will offset the risks in a bear market. When the moving average below turned negative in 2007, dividend stocks were hammered just like everything else. The dividend stock exchange-traded fund (DVY) performed much better after the slope of the moving average turned back up in 2009 (green arrow). The right side of the chart aligns with other bearish signals.
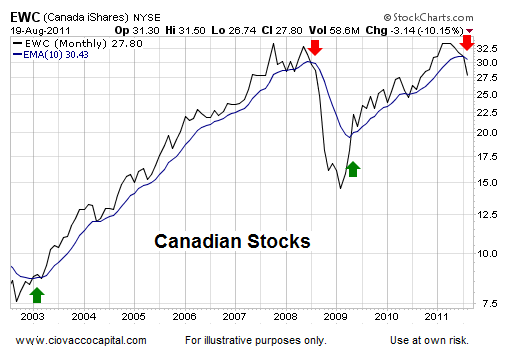
Another commodity-rich nation, Canada, is flashing a “be careful” signal. Compare the look of the blue line below the two red arrows. Notice how poorly Canadian stocks performed after the negative turn in the blue moving average in 2008.
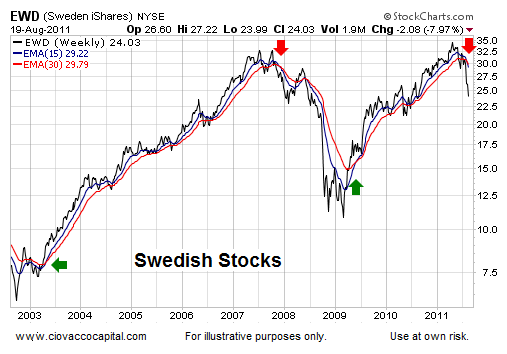
Last week, Sweden’s financial regulator said banks are unprepared for a freeze in money markets. Sweden’s stock market also has a bearish look to it.
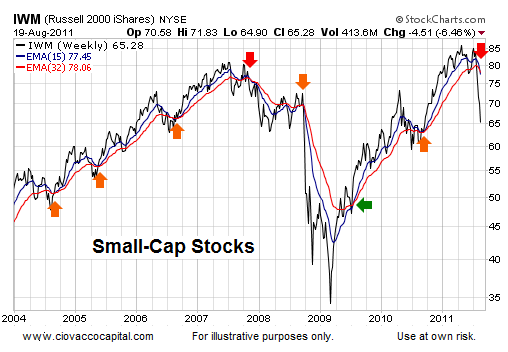
With higher growth rates, small-cap stocks are popular during periods of prosperity. Small-caps also carry higher risks than their blue-chip brethren, and thus tend to be avoided during recessions and bear markets. A bearish moving average crossover took place last week in the Russell 2000 (small-cap) Index adding another building block to the bearish case.
The economy and markets above could improve, but until we see evidence of a turn, we will err on the side of being conservative. If you review the charts and markets above while asking yourself, “Does this chart currently look like a bull market or the early stages of a bear market?”, it is difficult to draw bullish conclusions for stocks and the economy. The Fed’s Jackson Hole remarks could alter the market’s risk-reward profile, but as we noted last week QE2 winners are not forecasting a QE3 miracle.
By Chris Ciovacco
Ciovacco Capital Management
-
Copyright (C) 2011 Ciovacco Capital Management, LLC All Rights Reserved.
Chris Ciovacco is the Chief Investment Officer for Ciovacco Capital Management, LLC. More on the web at www.ciovaccocapital.com
Ciovacco Capital Management, LLC is an independent money management firm based in Atlanta, Georgia. As a registered investment advisor, CCM helps individual investors, large & small; achieve improved investment results via independent research and globally diversified investment portfolios. Since we are a fee-based firm, our only objective is to help you protect and grow your assets. Our long-term, theme-oriented, buy-and-hold approach allows for portfolio rebalancing from time to time to adjust to new opportunities or changing market conditions. When looking at money managers in Atlanta, take a hard look at CCM.
All material presented herein is believed to be reliable but we cannot attest to its accuracy. Investment recommendations may change and readers are urged to check with their investment counselors and tax advisors before making any investment decisions. Opinions expressed in these reports may change without prior notice. This memorandum is based on information available to the public. No representation is made that it is accurate or complete. This memorandum is not an offer to buy or sell or a solicitation of an offer to buy or sell the securities mentioned. The investments discussed or recommended in this report may be unsuitable for investors depending on their specific investment objectives and financial position. Past performance is not necessarily a guide to future performance. The price or value of the investments to which this report relates, either directly or indirectly, may fall or rise against the interest of investors. All prices and yields contained in this report are subject to change without notice. This information is based on hypothetical assumptions and is intended for illustrative purposes only. THERE ARE NO WARRANTIES, EXPRESSED OR IMPLIED, AS TO ACCURACY, COMPLETENESS, OR RESULTS OBTAINED FROM ANY INFORMATION CONTAINED IN THIS ARTICLE. PAST PERFORMANCE DOES NOT GUARANTEE FUTURE RESULTS.
Chris Ciovacco Archive |
© 2005-2022 http://www.MarketOracle.co.uk - The Market Oracle is a FREE Daily Financial Markets Analysis & Forecasting online publication.