


Aftershocks From a Nervous Stock Market ...
Stock-Markets / Stock Markets 2011 Aug 12, 2011 - 07:34 AM GMTBy: Marty_Chenard

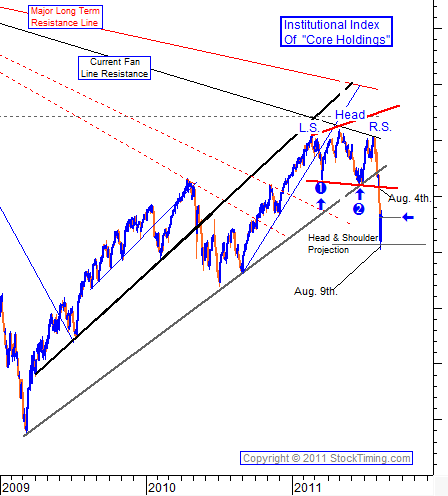
By now, you know why I like the Institutional Index of "core holdings". It is because it is not really an index, and it represents the action of the core holdings being held by institutional investors.
Since it isn't really an index, it can't be manipulated, tweaked, or experience stop running. It is because of these factors, that this index of core holdings can be strikingly accurate relative to market turns and projections on a technical analysis basis.
For instance, the Institutional Index recently showed a Head & Shoulder pattern as seen on today's chart. On August 4th, the Head & Shoulders neckline support was broken to the downside, and three days later ... the index stopped at its projection. (On Tuesday, August 9th, it actually fell slightly below our projection level for 10 minutes from 2:40 PM to 2:50 PM. And then .... money came in and the Institutional Index rose 5.1% in the next 1 hour and 10 minutes.)
So now the index is moving up in a retracement of the down move. The down move was so fast (4 days), that it was the equivalent of an earthquake in scientific terms.
After a sizeable earthquake... "Omori's law states that the rate of aftershocks decreases quickly with time. The rate of aftershocks is proportional to the inverse of time since the main shock. Thus whatever the odds of an aftershock are on the first day, the second day will have 1/2 the odds of the first day and the tenth day will have approximately 1/10 the odds of the first day." However, it is also possible that the first earthquake was a prelude to a second event that is larger in intensity."
Wednesday was a good example of an aftershock day with the S&P 500 dropping -4.42%, only to rise again yesterday (the next day) by +4.63%. Yes, the market is trying to retrace to the upside, but the volatility swings could be very unnerving even for professional traders.
This is not a market for everyone now. This is one of those cases where you have to ask yourself the question: "Is the upside potential worth the downside risk?" or ... Can I pass the sleep test? (Go to sleep without worrying about any trades you are in?)
Be cautious, be smart, and don't take risks if you don't fully understand what you are getting into. If making a trade causes you to be nervous or lose sleep, you are investing too much or taking too much risk.
By Marty Chenard
http://www.stocktiming.com/
Please Note: We do not issue Buy or Sell timing recommendations on these Free daily update pages . I hope you understand, that in fairness, our Buy/Sell recommendations and advanced market Models are only available to our paid subscribers on a password required basis. Membership information
Marty Chenard is the Author and Teacher of two Seminar Courses on "Advanced Technical Analysis Investing", Mr. Chenard has been investing for over 30 years. In 2001 when the NASDAQ dropped 24.5%, his personal investment performance for the year was a gain of 57.428%. He is an Advanced Stock Market Technical Analyst that has developed his own proprietary analytical tools. As a result, he was out of the market two weeks before the 1987 Crash in the most recent Bear Market he faxed his Members in March 2000 telling them all to SELL. He is an advanced technical analyst and not an investment advisor, nor a securities broker.
Marty Chenard Archive |
© 2005-2022 http://www.MarketOracle.co.uk - The Market Oracle is a FREE Daily Financial Markets Analysis & Forecasting online publication.